Control Quality and Resources
When the Problem Is Found at the Wrong Time
A construction project delivers a floor. The client walks through on day one and finds the tile is uneven in three spots. The tiler says the work was done to industry standard. The PM says the acceptance criteria were met. The client says they would not have approved the scope if they had known the floor would look like this. Now comes the question that should have been answered six weeks earlier: what counts as conforming, and who checks before delivery? Controlling quality and monitoring resources are both exercises in catching problems at the right time, while there is still something useful to do about them. Finding three uneven tiles during installation is an afternoon of rework. Finding them at final walkthrough when the client is standing there with their keys is a budget impact, a schedule extension, and a relationship problem that could have been avoided for the cost of one inspection at the right moment.
QA and QC: Two Different Jobs
Quality assurance focuses on whether the process is capable of producing compliant results. Quality control focuses on whether the actual deliverable conforms. Quality assurance is upstream and preventive: it sets up the procedures and methods that should produce good outputs. Quality control is inspection-based and detective: it examines what has actually been produced and determines whether it meets requirements.
Both matter, and confusing them leads to a common failure mode: a team that follows good procedures but never systematically checks whether the results actually conform to requirements. The process being right is a necessary condition. It is not a sufficient one. Products come out wrong even when the process is sound, because of materials variation, human error, unforeseen interactions with other systems, or requirements that were slightly misunderstood during execution. Quality control is the checkpoint that catches those deviations before they reach the client.
Inspection: The Core Activity
The primary activity in quality control is inspection: reviewing, measuring, or testing a deliverable against the quality standards and acceptance criteria defined during planning. This might be a formal walkthrough, a measurement against a dimensional specification, a software test suite run against defined pass/fail criteria, or a visual review against a documented standard. The form inspection takes depends on the type of deliverable and the nature of the quality requirements. What all inspections share is a reference: the standard that was agreed during planning, compared against the actual output.
When an inspection identifies a defect, three outcomes are possible. The defect can be corrected through rework: the work is brought into conformance before it proceeds to acceptance. It can be accepted with a documented variance: the client is informed, acknowledges the deviation from standard, and agrees to accept the deliverable anyway, with a written record of the decision. Or the defect can trigger a change request if addressing it requires a formal adjustment to scope, schedule, or cost. What should not happen is absorbing defects quietly, allowing non-conforming work to proceed without documentation or decision. Silent acceptance of defects sets a precedent, creates future liability, and removes the project's ability to demonstrate that delivery met the agreed standard.
The Quality Control Toolbox
Inspection does not mean eyeballing a deliverable and deciding it looks acceptable. It means applying structured tools that produce objective, repeatable results. Six tools appear regularly in quality control work, and each one answers a different kind of question about the state of the work being reviewed.
| Tool | What It Does | Best Used When |
|---|---|---|
| Control Chart | Tracks a process measurement over time and plots upper and lower control limits. Points outside the limits, or patterns within them, signal that the process is out of statistical control. | You have a repeating process (manufacturing, software build cycles, testing) and need to distinguish normal variation from a genuine problem. |
| Flowchart | Maps the steps in a process visually, including decision points and handoffs. Makes it possible to see where defects could enter and where the process has unnecessary complexity. | You need to analyze a process before changing it, or when a defect keeps appearing and you are not sure where in the sequence it originates. |
| Histogram | Shows the frequency distribution of a measurement across a dataset — how often each value or range of values occurs. Reveals whether output is clustering where it should be or drifting toward the limits. | You have measurement data from multiple inspections and need to see the shape of variation across the full dataset, not just individual readings. |
| Pareto Chart | A bar chart with defects or problems ranked from most frequent to least frequent, with a cumulative percentage line overlaid. Immediately shows which categories of defect account for the most failures. | You have a list of defects or quality failures and need to decide which ones to address first to achieve the greatest improvement for the effort. |
| Check Sheet | A structured form for recording defect data in real time during inspection. Each type of defect gets a row; the inspector marks occurrences. Produces a clean count by category at the end of the inspection period. | You are conducting repeated inspections of similar items and need a fast, consistent way to collect data that can be analyzed afterward. |
| Scatter Diagram | Plots two variables against each other to show whether a relationship exists between them. A pattern in the plot (upward slope, cluster, no pattern) indicates whether the variables are correlated. | You suspect that one variable is influencing defect rates and want to test whether the relationship is real before acting on it. |
The Pareto Principle: Where to Focus First
The Pareto Chart is named after Vilfredo Pareto, an Italian economist who observed in 1896 that roughly 80% of Italy's land was owned by 20% of the population. The ratio turned out to be a pattern that appears across many domains, including quality management: in most defect data, approximately 80% of quality failures trace back to 20% of the possible causes. This is the Pareto Principle, and it is the most actionable concept in the quality control toolbox. When you plot defects by category and rank them from most to least frequent, the Pareto Chart makes the 20% visible immediately. Fixing the top two or three categories on that chart will often eliminate the majority of defects, which is a far better return than working through every category with equal effort. It is a prioritization tool as much as a measurement tool. The principle does not mean the 80/20 ratio is exact on every project — it means the distribution is almost always uneven, and that fact should drive how you allocate your quality improvement effort.
Root Cause Analysis: The Fishbone and the Five Whys
Finding a defect is the beginning, not the end. A defect that is corrected without understanding its cause is likely to reappear, because the underlying condition that produced it is still present. Root cause analysis is the practice of tracing a problem backward from its symptom to the actual source, so that the correction addresses the cause rather than the effect.
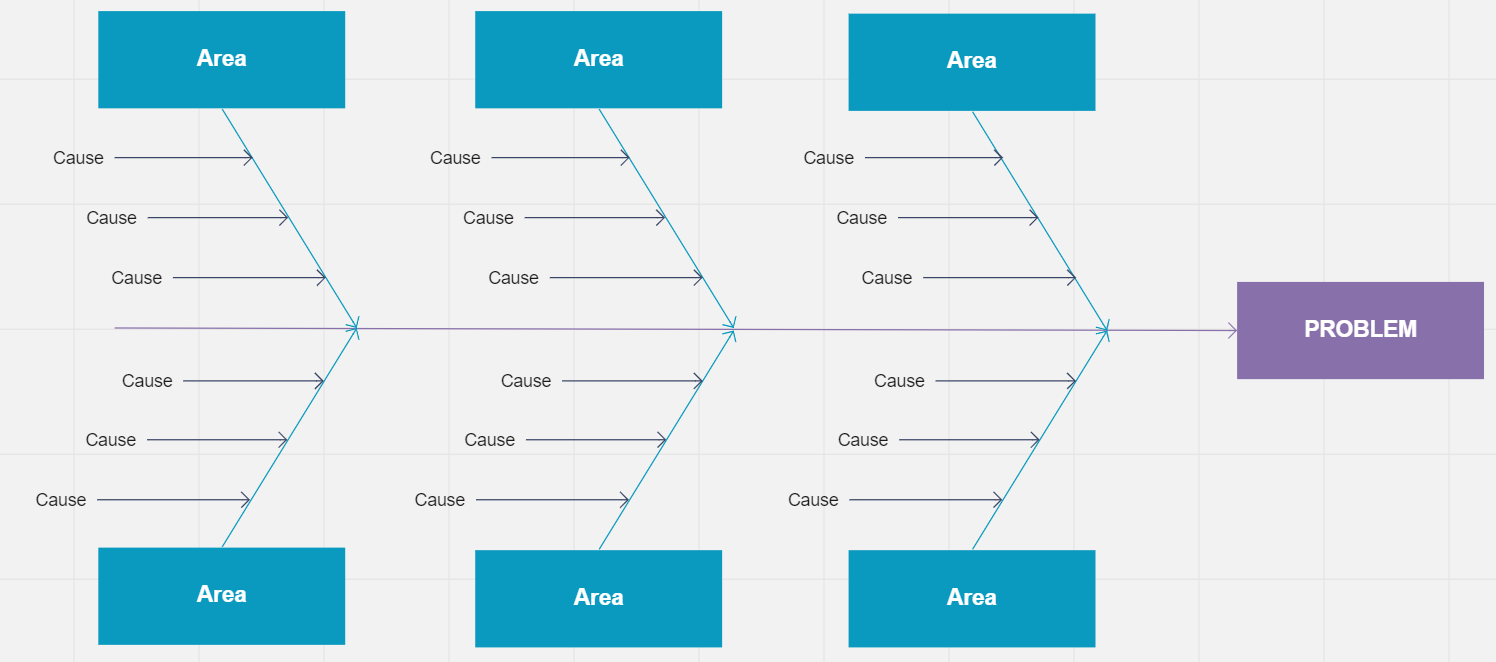
The fishbone diagram, also called the Ishikawa diagram after its creator Kaoru Ishikawa, is the most widely used root cause analysis tool in quality management. It looks like a fish skeleton: the problem or defect goes at the head, and the spine branches out into major cause categories. In manufacturing and construction, those categories are typically the six Ms: Manpower, Methods, Materials, Machines, Measurement, and Mother Nature (environment). In technology and service projects, the categories are often adapted to fit the context. Each branch then carries smaller branches that represent specific causes within that category. The value of the fishbone diagram is visual: it forces the team to consider every category of cause systematically rather than jumping to the most obvious explanation, and it makes the full landscape of potential causes visible at once.
The Five Whys technique takes a different approach. You start with the problem and ask "why?" — then ask "why?" again in response to the answer, and again, and again, until you reach the underlying condition that, if changed, would prevent the problem from recurring. Five iterations is a guideline, not a rule: some problems yield a root cause in three steps, others take seven. The technique works well on simpler, more linear problems where cause follows cause in a clear chain. As an example: a software module is delivered with the wrong data format. Why? Because the developer built it to the specification from the initial requirements document. Why was the specification wrong? Because the requirements were written before the upstream data provider had finalized their schema. Why didn't anyone flag the dependency? Because there was no requirement to verify upstream schemas before beginning development. Why was that not a process requirement? Because the project had no formal integration readiness checklist. That is the root cause: a process gap, not a developer error, and fixing it requires adding an integration readiness step, not correcting one developer's behavior.
Both tools are most useful when the team uses them together. The fishbone diagram opens the search wide: what categories of cause could explain this defect? The Five Whys then drills down within the most likely category. The combination produces a specific, traceable root cause rather than a general category of fault, and that specificity is what makes the corrective action stick.
The Cost Argument for Early Detection
There is a well-established principle in quality management that every PM should internalize: defects cost more to fix the later they are found. A design error caught during requirements review costs a conversation. The same error caught during testing costs developer time, test cycle repetition, and schedule impact. The same error found by the client after delivery costs rework, potential contract consequences, and the damage to the relationship that accompanies a visible quality failure. The economic case for quality control throughout the project rather than at the end is straightforward. One inspection at final delivery that finds fifteen defects is almost always more expensive than fifteen checks at appropriate points that each find one.
The challenge is that end-of-project inspection feels more efficient. You check once, at the end, when the whole thing is done. The problem is that "when the whole thing is done" is the worst possible moment to discover a structural quality issue. At that point, the team has moved on mentally, the schedule has no buffer left, and the client's patience for surprises is at its lowest. Quality control is most valuable when it is built into the delivery cadence, not appended at the end of it.
Validated Deliverables and the Quality Record
When a deliverable passes quality control, it becomes a validated deliverable, formally confirmed as conforming to requirements and ready for scope validation with the client. Quality control confirms conformance. Scope validation obtains the client's acceptance of that conforming deliverable. The two are sequential, not interchangeable: a deliverable can conform to every quality standard and still fail scope validation if the client's understanding of what was promised and the team's understanding of what was built never fully aligned. Quality control closes the internal quality gap. Scope validation closes the external acceptance gap.
The quality control record documents what was inspected, what criteria were applied, what was found, and how any defects were resolved. This record matters in three situations: disputes over whether the work met requirements, audits that review the project's quality management practices, and lessons learned that inform how future projects set up their quality checkpoints. A project that closes with a complete quality record has a documented history of how every deliverable was reviewed and accepted. A project that skips quality documentation has no evidence that anything was systematically checked, which is a very different position in any of those three situations.
| Field | Purpose |
|---|---|
| Deliverable inspected | What was checked — specific name or work package reference |
| Criteria used | The quality standard or acceptance criteria against which the deliverable was measured |
| Method | Inspection, test run, peer review, measurement, or other technique used |
| Result | Pass; fail; or conditional (accepted with documented variance) |
| Defects found | Description and count of non-conformances identified |
| Disposition | Rework required; accepted with documented variance; change request raised |
| Inspector / approver | Who conducted the inspection and who confirmed the result |
| Date | When the inspection took place — used to establish the timeline of quality decisions |
Monitoring Resources: The Same Problem, Different Dimension
Quality control and resource monitoring share an underlying failure mode: things go wrong without the PM noticing. In quality control, a defect accumulates between inspections. In resource monitoring, an overallocation or a gap in availability grows between status meetings. The result is the same in both cases: a problem that was visible and manageable at some earlier point arrives at a PM's desk as a crisis.
The resource management plan, built during planning, specifies what resources are needed, when, and at what level of effort. In monitoring and controlling, that plan is the baseline. The monitoring question is simple: is what is actually happening matching what the plan assumed? Are the right people assigned to the right activities at the capacity the schedule requires? Are physical resources arriving when the schedule needs them? When the answer diverges from the plan, the PM needs to know before the schedule feels the impact, not after a deliverable is late and the explanation is that someone wasn't available.
A simple utilization check run weekly makes the gap between planned and actual availability visible before it becomes a schedule problem:
| Resource | Planned Availability | Actual Availability | Variance | Schedule Impact | Action |
|---|---|---|---|---|---|
| Data migration lead | 100% this week | 60% (supporting production issue) | -40% | Migration deliverable at risk by end of week | Escalate to sponsor; negotiate return date or replacement |
| Testing environment | Available Monday | Delayed to Wednesday (IT configuration) | 2 days | Test cycle compressed; overtime likely | IT to expedite; PM to assess whether test scope can be sequenced |
| Business analyst | 50% this week | 50% confirmed | None | None | No action needed |
Overallocation: The Hidden Schedule Risk
Resource overallocation is one of the most common problems in project execution, and it rarely announces itself directly. A team member is assigned to two parallel activities that each need their full attention. They divide their time between them, both activities slow down, and because both are technically "in progress" neither shows as a delay in the weekly status report. By the time the PM notices, two deliverables are behind instead of one, and the sprint to catch up affects a third. Monitoring resource utilization means looking not just at who is assigned to what, but at whether the people assigned have the capacity to complete the work at the pace the schedule assumes. Those are different questions, and the second one requires more than a task list.
Six weeks into a data platform build, a project manager reviewing the week's progress asked each team member directly what they had accomplished. The answers surfaced something that was not visible in the task tracker. Three developers were waiting on deliverables from upstream teams that were running late. They were available, technically assigned to tasks, and blocked. Two others were working late every day to keep a shared integration service stable while also delivering their own sprint commitments.
None of this had been raised in the weekly standup. The three who were blocked assumed the upstream delays would resolve. The two who were overloaded did not want to flag a capacity problem because the integration stability work was informal and not on anyone's plan. The task tracker showed six active tasks with status "in progress." The actual situation was three people idle and two approaching burnout, with a shared integration risk building in the background that had not been escalated.
The PM's response was two conversations. First, the upstream dependency owners: a direct question about when the blocked deliverables would be available and what the project could do to unblock them. Second, the two overloaded team members: a scope conversation about the integration work, which surfaced that it belonged on the issue log, had an owner, and needed a formal decision about whether it was within the project's scope or should be escalated to infrastructure. Both conversations happened because the PM asked directly rather than reading the task tracker. The task tracker had shown nothing wrong. The conversations showed the real picture.
When Resources Are Pulled Away
Projects regularly lose resources they planned to keep. A developer gets temporarily assigned to an urgent production issue. A key subject matter expert is needed by another project at a critical moment. A contractor's availability changes for reasons outside the project's control. Each of these creates a resource variance: actual availability is lower than the plan assumed, and the schedule built around that availability is now in question. The PM's response options are limited but defined: negotiate for the resource to return, find a replacement, adjust the schedule to reflect the reduced capacity, or escalate to the sponsor if the impact is significant enough to warrant it. The one response that consistently produces the worst outcome is absorbing the impact silently and hoping the team catches up. Teams almost never catch up from an unacknowledged resource deficit. The schedule absorbs it quietly, and the PM discovers the impact only when a milestone is missed.
Physical Resources: Often Overlooked
Resource control applies to equipment, materials, and facilities, not only people. A construction project running short on materials mid-phase. A data center migration that cannot get server rack time during the planned window. A training delivery project where the classroom is double-booked for the delivery week. Physical resource gaps are often more disruptive than human resource gaps because they create hard stops: work simply cannot proceed until the resource arrives. Monitoring the availability of physical resources against the schedule is part of resource control, and it is the part most often left to chance until a gap becomes visible as a project pause. The question to ask regularly is not just whether people are available, but whether everything the schedule needs, materials, equipment, facilities, access credentials, is confirmed and arriving on time.
What's Next
The next chapter, Monitor Communications, addresses a process that carries some of the project's most consequential risks: confirming that the information being sent is actually reaching the people who need it, in a form they can use, and that the communication plan is working as designed rather than generating reports that nobody reads.
Reflect
- At what points in your current or most recent project were quality checks performed on major deliverables? Were they built into the delivery cadence, or concentrated at the end? What would it take to move a checkpoint earlier?
- If you plotted the defects from your last project on a Pareto Chart, which two or three categories would you expect to account for the majority of failures? What would fixing those categories have required, and why were they not addressed earlier?
- Think of a defect or quality failure that recurred more than once on a project you managed. Was the root cause ever identified formally? If you applied the Five Whys technique to it now, how far back does the chain go before you reach a process or structural cause rather than a person's error?
- Have you experienced a situation where a defect found at final delivery cost significantly more than the same defect would have cost if caught during production? What structural change would have caught it sooner?
- Think about resource monitoring on your recent projects. Did you know the utilization and availability of each team member weekly, or did you learn about gaps from schedule slips? What would direct weekly checking have changed?
- Have you lost a resource to another project or initiative mid-execution? What options were available to you at that moment, and which did you choose? Looking back, was there a better response?
Advanced Lean Six Sigma — Data-Driven Excellence
Solve complex problems, reduce variation, and improve performance with confidence. This course is designed for professionals who already know the basics and want to apply advanced Lean Six Sigma tools to real business challenges.
This is not abstract statistics or theory-heavy training. You’ll use Excel to perform real analysis, interpret results correctly, and apply tools like DMAIC, SIPOC, MSA, hypothesis testing, and regression without memorizing formulas or relying on expensive software.
You’ll learn how to measure baseline performance, analyze process capability, use control charts to maintain stability, and validate improvements using statistical evidence. Templates, worked examples, and structured walkthroughs help you apply each concept immediately.
Learn through a complete, real-world Lean Six Sigma project and develop the skills to lead data-driven improvements with credibility. If you’re ready to move beyond basics and make decisions backed by data, enroll now and take your Lean Six Sigma expertise to the next level.

Take Control of Project Performance!
HK School of Management helps you go beyond status reports and gut feelings. In this advanced course, you’ll master Earned Value Management (EVM) to objectively measure progress, forecast outcomes, and take corrective action with confidence. Learn how WBS quality drives performance, how control accounts really work, and how to use EAC, TCPI, and variance analysis to make smarter decisions—before projects drift off track. Built around real-world examples and hands-on exercises, this course gives you practical tools you can apply immediately. Backed by our 30-day money-back guarantee—low risk, high impact for serious project professionals.
Learn More