Schedule Planning: Activities, Sequences, and Estimates
Before You Build the Schedule
Before defining a single activity, the team needs to agree on how the schedule will be built, maintained, and controlled. This is the schedule management layer: not the schedule itself, but the decisions that determine how the schedule will function as a management tool. The choices made here shape everything that follows. What tool will hold the activity list and schedule? Who is responsible for providing estimates for each area of work? Which estimating methods will the project use: analogous, parametric, bottom-up, or three-point? How will dependencies be reviewed and who must agree before they are locked? How often will the schedule be updated, and what format will those updates take? What level of variance from the baseline triggers a conversation, and what level triggers a formal escalation? Who has the authority to approve changes to committed dates? These decisions do not need to be elaborate. On a smaller project, a few agreed norms in a project brief may be enough. On a larger project, they may warrant a dedicated section in the project management plan. The essential point is that they are explicit. A team that has never discussed how the schedule will be managed will improvise each of these questions under pressure, and the answers tend to be inconsistent, reactive, and expensive.
From Deliverables to Work
The Work Breakdown Structure defines what the project will deliver. Schedule planning starts where the WBS ends, with the question of what work actually produces those deliverables. This transition is one of the most important conceptual lines in project planning, and it is easy to blur. A WBS work package is a noun. It names something the project will produce: "kitchen sink installed," "user authentication module," "training program complete." An activity is a verb. It names something that must happen: procure the sink, receive and inspect the sink, install the sink, test the sink against the acceptance criteria. For every work package in the WBS, defining activities means asking what specific actions must occur to produce that deliverable, in what order, performed by whom, using what resources. Teams that skip this step and build schedules directly from WBS work packages end up estimating and sequencing deliverables rather than work. The result looks like a schedule but cannot be executed, because nobody has thought through the underlying activities. Missing tasks, hidden dependencies, and impossible timelines are the predictable consequences, discovered late, when they are expensive to correct.
Rolling Wave Planning
Not all work can be planned at the activity level from the start of the project. Work that lies months away, or that depends on outcomes not yet determined, cannot be meaningfully decomposed into specific activities without adding planning effort that produces no real accuracy. Rolling wave planning is the practical answer: define activities in detail for the near-term work and hold future work at a higher level of decomposition until it comes close enough to plan properly. The discipline is maintaining a consistent cadence of decomposition as the project advances, so that future work is broken down into activities before it needs to be scheduled and resourced, not after. A project running rolling wave planning should always have a detailed, activity-level view of the near-term horizon and a progressively less detailed view of the work beyond that. The horizon shifts forward as the project moves, and the PM's job is to keep the planning effort tracking just ahead of the execution front rather than scrambling to plan work that has already started.
Milestones
A milestone is a significant event in the project timeline, not a task and not a duration. Design approved. Materials received on site. System accepted by the client. Milestones carry zero duration in the schedule because they mark a moment rather than a span of work. Note the distinction in the second example: the procurement work and the shipment are activities with duration; "materials received on site" is the milestone that marks their completion. Internally, milestones create explicit checkpoints: a natural pause point at which the team confirms that everything required for the next phase is actually in place before proceeding. Externally, they give stakeholders and sponsors a legible view of project progress without requiring them to interpret a detailed activity list. A sponsor who wants to know whether the project is on track can often get a meaningful answer from five milestone dates rather than fifty activity rows. Well-placed milestones make that communication efficient without sacrificing accuracy, and they give the PM a shared language with the sponsor that survives the complexity of the underlying schedule.
The Activity List
The output of defining activities is the activity list: a structured record of every activity needed to produce each work package in the WBS, with a unique identifier, a name clear enough to be unambiguous, and a scope description that tells someone unfamiliar with the project exactly what is and is not included in that activity. At the point of initial definition, each entry also carries the assumptions it relies on, any constraints it operates under, and the resource type or role required. Predecessor and successor relationships are added progressively as the team works through sequencing. The activity list is the raw material for everything that follows. Sequencing, duration estimating, resource assignment, and cost estimating all work from this list. The quality of the schedule the team eventually produces is bounded by the quality of the thinking that went into building it.
A brief example shows what this looks like in practice. Consider work package 1.3.1, Network Cabling and Hardware Installation, from the RtR office relocation project.
| ID | Activity Name | Scope Note | Resource Type | Assumption |
|---|---|---|---|---|
| IT-01 | Survey new site network infrastructure | Covers cabling, switches, and patch panel locations only | Network engineer | Site access available from move-in minus 30 days |
| IT-02 | Procure cabling and hardware | Per approved specs; excludes end-user devices | Procurement + IT lead | Vendor delivery within 10 business days |
| IT-03 | Install cabling | Cat6 structured cabling throughout; excludes server room | Licensed cabling contractor | Clear access to ceiling and wall cavities |
| IT-04 | Install and configure network hardware | Switches, patch panels, and wireless access points | Network engineer | IT-03 complete; hardware on site |
| IT-05 | Test and sign off network | Full connectivity test; generate sign-off report | Network engineer + IT manager | IT-04 complete; test devices available |
The Resource Register
As activities are defined, the people and resources needed to execute them become visible. The resource register captures this: a record of the roles, skills, and physical resources required across the project, with availability information attached where it is known. In the activity list example above, the network engineer appears across multiple activities. Before those activities can be scheduled with confidence, the PM needs to know whether that resource is available, whether it is one person or a team, and whether they are shared with other projects. A schedule built without consulting resource availability is not wrong by accident. It is a plan that has assumed perfect availability and will be revised under pressure once the reality of competing demands and human calendars becomes visible. The resource register is how the team surfaces those constraints before they become surprises during execution.
Why Sequencing Matters
Sequencing establishes the logical order in which activities must occur. Some of that order is dictated by physical reality: you cannot test a system before it is installed, and you cannot install what has not been procured. Other sequencing decisions reflect professional judgment: experienced practitioners know that certain tasks produce better outcomes when completed in a particular order, even when the work could technically be arranged differently. The practical purpose of sequencing is to produce a network of activity relationships that makes the schedule executable. A list of activities without a sequence is an inventory, not a schedule. Adding sequence tells the team what must happen before each activity can begin, what can proceed in parallel, and what cannot start until something else is finished. Sequencing is a team activity, not something the project manager does in isolation. Some dependencies are visible to anyone paying attention. Others are only apparent to someone with direct experience in that type of work. A dependency that a developer knows instinctively about build and test relationships, or that a site superintendent knows about the order of trades, would be invisible to a PM working from a document. Building the sequence with the people who will execute the work is how the non-obvious dependencies get surfaced before they become schedule failures.
Mandatory and Discretionary Dependencies
Dependencies fall into two broad categories, and distinguishing between them has real consequences for schedule management. Mandatory dependencies are dictated by the nature of the work itself. You cannot frame walls before the foundation is poured. You cannot sign a contract with a vendor you have not yet selected. The constraint is physical, legal, or logical, and it cannot be overridden without changing the fundamental approach to the work. Discretionary dependencies reflect professional practice rather than physical necessity. Activity B follows activity A because experience has shown that order produces fewer defects, fewer rework cycles, or fewer handoff problems. Discretionary dependencies are the right call under normal conditions, and they are the first place to look when the schedule needs to be compressed. A project manager who knows which dependencies are mandatory and which are discretionary has a principled basis for responding to compression requests. One who does not know the distinction has no choice but to refuse or compress arbitrarily, and both responses carry hidden costs.
Internal and External Dependencies
Beyond mandatory and discretionary, dependencies also divide into internal and external. Internal dependencies sit entirely within the project team's control: activity A on your team must finish before activity B on your team can begin. External dependencies depend on something outside your control: a vendor's delivery schedule, a regulatory body's approval timeline, another project completing a handoff, a client decision, or a facility becoming available. External dependencies belong in two places: the schedule, where they appear as predecessor relationships, and the risk register, where they are tracked as schedule risks. A vendor who commits to a ten-day delivery and misses it by three weeks does not just affect one activity. It shifts every downstream activity that depends on the delivery, and if any of those activities sit on the critical path, it moves the project end date. Identifying external dependencies explicitly early, rather than assuming they will be met, is how a PM stays ahead of that class of risk.
The Four Dependency Types
Within those two categories, dependencies take four specific forms. Finish to Start is the most common: activity B cannot begin until activity A is complete. It should be used because it reflects the real logic of the work, not simply because it is the easiest option. Finish to Finish means activity B cannot complete until activity A is complete, but B can start before A finishes, allowing overlapping work with a controlled finish relationship. Start to Start means activity B cannot start until activity A has started, after which both may proceed in parallel. Start to Finish is the least common type: B cannot finish until A has started, and it appears in handoff or cutover scenarios where one team cannot formally close their work until the next has formally begun. Understanding which type a given dependency is matters most when you are looking for schedule compression. Switching a Finish to Start relationship between two large work streams to a Start to Start or Finish to Finish arrangement can unlock significant parallelism, but only if the team has documented the dependency type precisely enough to evaluate whether that switch is actually possible.
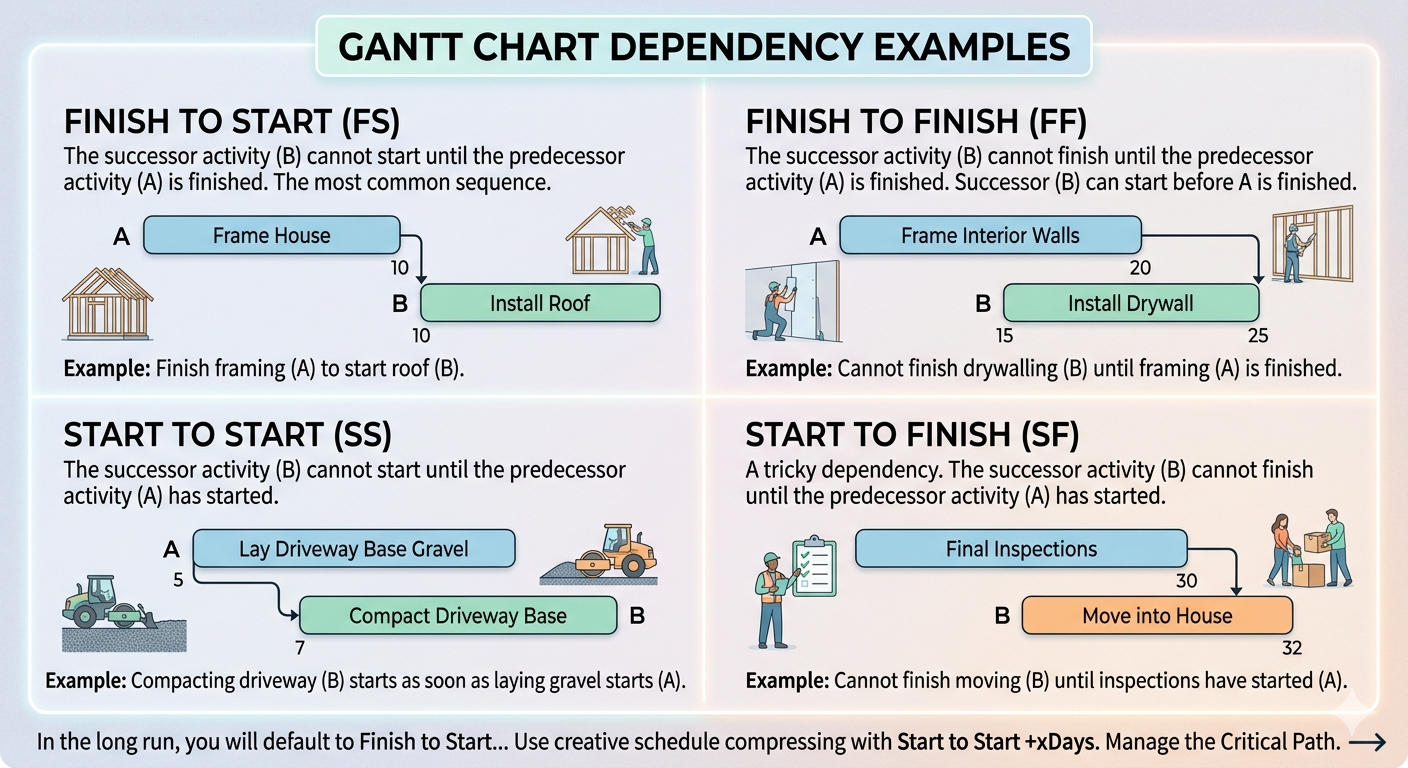
| Type | Definition | Example | When to Use |
|---|---|---|---|
| Finish to Start (FS) | B cannot begin until A is complete. | Cabling must finish before hardware installation can begin. | Default for most relationships; use when the next activity truly cannot start until the prior one is done. |
| Finish to Finish (FF) | B cannot finish until A finishes, but B may start before A is complete. | Interior painting cannot finish until plastering finishes, but painting can begin on completed sections while plastering continues elsewhere. | When two activities must conclude together but can overlap during execution. |
| Start to Start (SS) | B cannot start until A has started, then both run in parallel. | Compacting driveway base can begin as soon as laying the base material begins. | When a successor can run alongside its predecessor from the moment the predecessor is underway. |
| Start to Finish (SF) | B cannot finish until A has started. | A night-shift team cannot formally close down until the day shift has officially started its handover. | Rare. Typically used in shift handoffs or system cutovers where one activity must remain open until the next formally begins. |
Leads and Lags
Leads and lags fine-tune the timing within a dependency relationship without changing its fundamental logic. A lag adds a waiting period between two connected activities: the dependency holds, but the successor cannot begin until a specified amount of time has passed after the predecessor condition is met. Concrete must cure before load-bearing work can proceed. A regulatory submission requires a waiting period before a response can come. The lag captures that required interval in the schedule rather than allowing it to be forgotten until it appears as an unexpected delay. A lead allows a successor activity to begin before its predecessor is fully complete, overlapping the two activities by a controlled amount. When a document is partially drafted, review can begin on completed sections before writing is finished. A lead should only be used when the overlap is genuinely manageable. If the predecessor's output changes after the successor has already started, some of that early work may need to be redone. An undisclosed lead hidden inside an estimate is less honest than an explicit dependency with a controlled overlap.
The Network Diagram
A project network diagram presents the complete activity sequence as a visual map: activity boxes connected by arrows that represent the dependency relationships between them. The network makes the sequencing logic visible in a way that a list cannot. You can follow the flow of work from start to finish, identify chains of activities that share no flexibility, and spot points where parallel work streams converge in ways that create schedule risk. Building the network diagram is also a structured review activity. When the team walks through a network diagram together, they find dependencies that were assumed but never documented, sequences that do not survive scrutiny from someone with different functional knowledge, and convergence points that look manageable in isolation but represent serious bottlenecks when resource constraints are added. Catching those problems at the diagram stage is far cheaper than catching them after the schedule is baselined and execution has begun.
Every Estimate Contains Uncertainty
Every duration estimate in a project contains uncertainty. The question is how much uncertainty, in which direction, and whether the plan makes that uncertainty visible and manageable. That is the honest starting point for schedule estimation, and it changes how a project manager gathers, documents, and uses the numbers the team provides. Two opposing forces consistently push estimates in opposite directions. Optimism leads people to estimate based on how long the work takes when everything goes well, leaving out the delays, interruptions, rework cycles, and unexpected complications that are statistically inevitable across a full project. Parkinson's Law works in the opposite direction: when a task is given more time than it strictly requires, the extra time tends to be consumed rather than returned to the schedule. Both forces are human and predictable. A project manager who understands them can design an estimation process that partially compensates for both, rather than simply averaging whatever numbers the team provides.
Analogous and Parametric Estimating
Analogous estimating uses historical data from similar activities on previous projects to estimate the current one. If the organization has completed comparable work before and tracked how long specific activities took, that data becomes a reference point. Analogous estimating is fast and useful early in planning when detailed information is not yet available. Its accuracy depends entirely on how similar the historical work genuinely is to the current work. When the comparison is solid, the estimate is reliable. When the projects differ in meaningful ways, the analogous figure is a starting point that needs further development. Parametric estimating takes advantage of a predictable relationship between a measurable variable and the time required to complete the work. A network engineer who consistently runs structured cabling at a known rate per floor, or a training team that takes a consistent number of days per course module, has the raw material for parametric estimates. The calculation is straightforward: if laying one floor of cabling consistently takes three days, and the new office has four floors, the estimate is twelve days. Organizations that repeat similar work at scale can build libraries of rate data that make this approach both efficient and accurate. The critical dependency is data quality. A parametric model built on unreliable historical data produces estimates with an appearance of precision that the underlying numbers do not support.
On the RtR project, the PM used analogous reasoning to produce a first-pass estimate for the physical move. Records from a warehouse relocation the company had completed three years earlier showed that a single-floor, single-use-type space took a moving crew five days. The new space was two floors of mixed office and warehouse content with fleet transport requirements the earlier move did not have. The analogous estimate opened at ten days and went immediately to the Fleet Manager for review. He confirmed the ten-day floor, added two activities the prior project had handled differently, and the estimate moved to thirteen days before the cabling contractor added their input. The analogous figure was not the final number. It was the structured starting point that allowed the right experts to react to something specific rather than estimate from a blank page.
Parametric estimating works when the organization has done enough similar work to know a reliable rate. On the RtR project, three activity types in the IT and physical setup work had enough historical data to use this approach. The table below shows each rate, the measurable variable, and the resulting estimate.
| Activity | Historical Rate | Variable | Estimate | Rate Source |
|---|---|---|---|---|
| Install Cat6 cabling | 3 days per floor | 4 floors | 12 days | 3 prior installations by same contractor |
| Install security cameras | 0.5 days per camera | 24 cameras | 12 days | Vendor's own installation log from 5 projects |
| Set up staff workstations | 0.25 days per workstation | 40 workstations | 10 days | IT lead's internal records from two prior office setups |
Each rate came from a different source: the cabling contractor's own job logs, the security vendor's installation history, and the internal IT lead's records from previous setups. The estimates are only as reliable as those sources. The cabling rate came from three prior installations in similar buildings — solid data. The camera rate came from the vendor's own log, which reflects experienced installers under standard conditions. The IT lead flagged that the workstation estimate assumes pre-configured images; if setup requires manual configuration per machine, the rate drops to 0.5 days each, and the estimate becomes 20 days. That flag went into the basis of estimate.
Bottom-Up Estimating
Bottom-up estimating works by estimating each activity at the lowest useful level of decomposition and then rolling those estimates up through the WBS to understand effort and duration within each work package. It is the most accurate approach when activities are clearly defined and estimators have relevant experience, and it is also the most time-consuming. An important distinction: rolling up activity estimates can tell you the total effort within a work package, but the total project duration does not come from simply adding up all activity durations. The project duration is determined by the sequenced network and the critical path. Parallel paths do not add together. An activity that runs at the same time as five others contributes its duration once, not six times. This is why the network and the critical path analysis follow estimating rather than replacing it. Bottom-up estimating is most valuable as a validation step, used after a faster method has produced a first draft to check whether the aggregate effort is credible and where the largest sources of uncertainty sit.
Applied to work package 1.3.1, the network engineer and IT lead estimated each of the five activities independently. The table below shows what the bottom-up pass produced.
| Activity | Duration | Estimator |
|---|---|---|
| IT-01: Survey new site network infrastructure | 2 days | Network engineer |
| IT-02: Procure cabling and hardware | 3 days (plus 10-day vendor lead time) | Procurement + IT lead |
| IT-03: Install cabling | 12 days | Cabling contractor |
| IT-04: Install and configure network hardware | 5 days | Network engineer |
| IT-05: Test and sign off network | 2 days | Network engineer + IT manager |
| Work package total effort | 24 days |
The 24-day total tells the PM what this work package will cost in labor time. It does not say when the work package will finish. IT-02 procurement runs in parallel with the site survey and adjacent early work. IT-03 and IT-04 can begin to overlap once cabling is sufficiently advanced. The elapsed duration of the work package, determined by sequencing, will be shorter than 24 days. Bottom-up estimating surfaces the effort. The network diagram determines how that effort maps to calendar time. Both are necessary. Neither replaces the other.
Diminishing Returns and Resource Limits
More resources do not always shorten an activity, and more estimating effort does not always produce better decisions. After a point, adding people to an activity creates coordination overhead, handoff delays, and quality risk. A task that requires one skilled electrician for four days cannot be done in one day by adding three more electricians, because some of the work is sequential by nature and coordination between four people takes time that one person does not spend. This is the law of diminishing returns applied to project resourcing: the productivity gain from each additional resource decreases as more are added, and eventually reverses. When planning estimates and considering how resources affect duration, the PM's job is to identify where parallelism is genuinely possible, where it creates more coordination than it saves, and where the bottleneck is skill rather than headcount. Adding a second junior resource to a task that requires one senior expert does not halve the duration. It may extend it.
Learning Curve and New Technology Risk
When an activity depends on a tool, platform, vendor method, or technology the team has not worked with before, the estimate carries a learning-curve risk that historical data from familiar work does not capture. A vendor's promised efficiency for their product reflects steady-state performance by experienced users. The team's actual performance during the first deployment of that product may look quite different. New technology estimates need an explicit learning-curve assumption: how long will it take the team to reach the proficiency level the estimate assumes, and what happens to the schedule if that ramp-up takes longer than expected? The same principle applies to regulatory environments, compliance frameworks, or client processes the team is encountering for the first time. Documenting this assumption explicitly is not pessimism. It is the kind of transparency that allows the team to track the actual learning curve during early execution and know whether the estimate's assumption is holding.
Three-Point Estimating
Three-point estimating addresses uncertainty directly by replacing the single-point estimate with three distinct values. The optimistic estimate reflects how long the activity takes when everything goes smoothly. The pessimistic estimate reflects how long it takes when things go poorly. The most likely estimate reflects typical conditions, accounting for the normal level of complication and interruption the team actually experiences. One common weighted version combines them using a formula that gives the most likely estimate four times the weight of the optimistic or pessimistic values, reflecting the observation that most activities perform closer to the expected case than to the extreme cases.
On the RtR project, IT-04 (install and configure network hardware) was a strong candidate for three-point estimating. The network engineer had installed cabling before but had not configured this vendor's switching platform in a live environment. The optimistic case assumed the vendor configuration guides were accurate and no compatibility issues emerged. The pessimistic case reflected the possibility of a firmware conflict requiring a vendor callback. The table below shows the three values and the weighted calculation.
| Input | What It Represents | Example Value |
|---|---|---|
| Optimistic (O) | Duration if everything goes smoothly | 5 days |
| Most Likely (M) | Duration under normal conditions | 8 days |
| Pessimistic (P) | Duration if significant problems occur | 15 days |
| Expected Duration | (O + 4M + P) ÷ 6 | (5 + 32 + 15) ÷ 6 = 8.7 days |
Three-point estimating is most valuable for activities where uncertainty is real and consequential: high-risk tasks, novel work, or activities that depend on external inputs the team cannot fully control. Some organizations use a simple average of the three values; others use more sophisticated simulation techniques for activities with very high stakes. The three-point format is less important than the habit of collecting all three values and discussing the conditions that would drive each case.
Each estimating method answers a different situation. The table below summarizes when each one is most appropriate.
| Method | Use when... | Accuracy | Time to produce |
|---|---|---|---|
| Analogous | Similar past work exists; early planning when detail is limited | Wide range; useful as a starting point | Fast |
| Parametric | Reliable rate data is available from past work or vendors | Narrow if the rate data is solid; unreliable if the data is weak | Fast |
| Bottom-up | Activities are clearly defined; a first-pass estimate needs validation | Highest; reflects actual activity-level thinking | Slow |
| Three-point | Activity is new, uncertain, or depends on external factors the team cannot control | Explicitly stated range; honest about uncertainty | Medium |
Basis of Estimate
A duration estimate is more useful when it arrives with the reasoning behind it. The basis of estimate captures how the number was produced, what assumptions it relies on, what it excludes, and what risk could change it. For estimates that matter, this documentation is not overhead. It is the difference between a number a PM can defend and a number a PM can only repeat. When an estimate turns out to be wrong, the basis of estimate is where the team looks to understand why. When a scope change arrives, the basis of estimate is what allows the PM to say clearly which activities will be affected and how. The format does not need to be elaborate. A row per activity is often enough.
| Activity | Estimate | Method | Key Assumption | Risk to Estimate |
|---|---|---|---|---|
| Pour footings | 2 days | SME estimate from similar jobs | Weather is dry; full crew available | Rain or crew shortage could double duration |
| Install cabling — floors 1-4 | 12 days | Parametric: 3 days/floor | Clear access to ceiling cavities | Access restrictions add 1-2 days per floor |
| IT-04: Install and configure network hardware | 8.7 days | Three-point (5/8/15) | Vendor configuration guides are accurate; no firmware conflicts | New platform for this team — pessimistic case likely if compatibility issues emerge |
Estimates Are Not Promises
The most damaging failure in estimation is not producing a number that turns out to be wrong. It is producing a culture where team members believe their estimates are personal performance commitments rather than professional inputs to a planning process. When people fear that a duration estimate will be treated as a promise, they respond rationally: they pad. They add undisclosed buffer, inflate the pessimistic case, and give conservative numbers that protect them from being held accountable for something they cannot control. The schedule baseline that results from this process is technically derived from team input and practically misleading, because the uncertainty has been buried rather than surfaced. The project manager's role in estimation is to create conditions where honest numbers emerge. That means being explicit that an estimate is a planning input, not a guarantee. It means asking for risk information alongside the number: what would make this take longer than you expect? That question, answered consistently across the activity list, builds the risk register at the same time it improves the schedule. An honest estimate with a known risk is always more useful than a padded estimate with hidden buffer the PM cannot see or manage.
What's Next
The activities are defined, sequenced, and estimated. The next step is to determine what the network of activities actually implies for project duration: which path through the network is the longest, which activities have flexibility, and what the schedule baseline will commit to. That analysis is the critical path method, and it is where the work done in this chapter becomes a schedule the project can be held to.
Reflect
- Think about a project where the schedule was built from deliverables rather than from a defined activity list. What tasks turned out to be missing, and when did the omission first create a visible problem?
- Identify an external dependency in a project you have worked on. Was it tracked in the risk register as well as the schedule? If not, when did it first become a problem?
- Recall an estimation process where team members were visibly padding their estimates. What signal told you that was happening, and what was the consequence for the schedule baseline?
- Think of an activity in a past project that depended on a new tool or technology. How was the learning curve accounted for in the estimate, and how accurate was that assumption?
AI for Project Managers — Build Plans Faster, Lead Better
Turn messy inputs into structured project plans in minutes. If you are a project manager tired of spending hours on documentation, this course shows you how to use AI to work faster while staying fully in control.
This is not a generic AI course. You will learn how to use AI as a practical co-pilot to build real project artifacts—charters, WBS, schedules, risk registers, and executive reports—using structured, reliable prompt frameworks.
You will also learn how to keep your project aligned across scope, schedule, cost, and risk, and how to interpret performance data like Earned Value Management to support better decisions and communication.
Everything is designed for immediate use. You get ready-to-use prompt templates and workflows you can apply right away in your projects. Watch the video to see how it works and start building your first AI-supported project plan.

Launch your career!
HK School of Management provides world-class training in Project Management with AI and Agile Methodologies. Just for the price of a lunch you can transform your career, and reach new heights. With 30 days money-back guarantee, there is no risk.
Learn More