Project Management Essentials
Where Projects Come From
Most project failures are not execution failures. They are set-up failures, projects that began without clarity about what they were responsible for, why the investment was justified, or what the organizational conditions would demand of the team. By the time a project manager is assigned, a significant amount of the context that determines whether the project succeeds or struggles is already in place. Someone decided the investment was worth making. Someone defined the problem being solved. Someone made assumptions about what success looks like. Your job as a project manager is not just to execute. It is to understand all of that context deeply enough to work within it, challenge it when it is wrong, and protect it when it is right. The concepts in this chapter are the foundation everything else is built on.
Project Boundaries — What You Own and What You Don't
Stephen Covey's framework of circles maps directly onto how projects work. Covey describes two zones: the circle of concern, which covers everything you care about and might be affected by, and the circle of influence, which covers everything you can actually change. Effective people invest their energy inside the circle of influence. They stay aware of the circle of concern without letting it consume focus that belongs on the boundary they can actually control. Projects operate exactly the same way, and the diagram below captures that relationship directly.
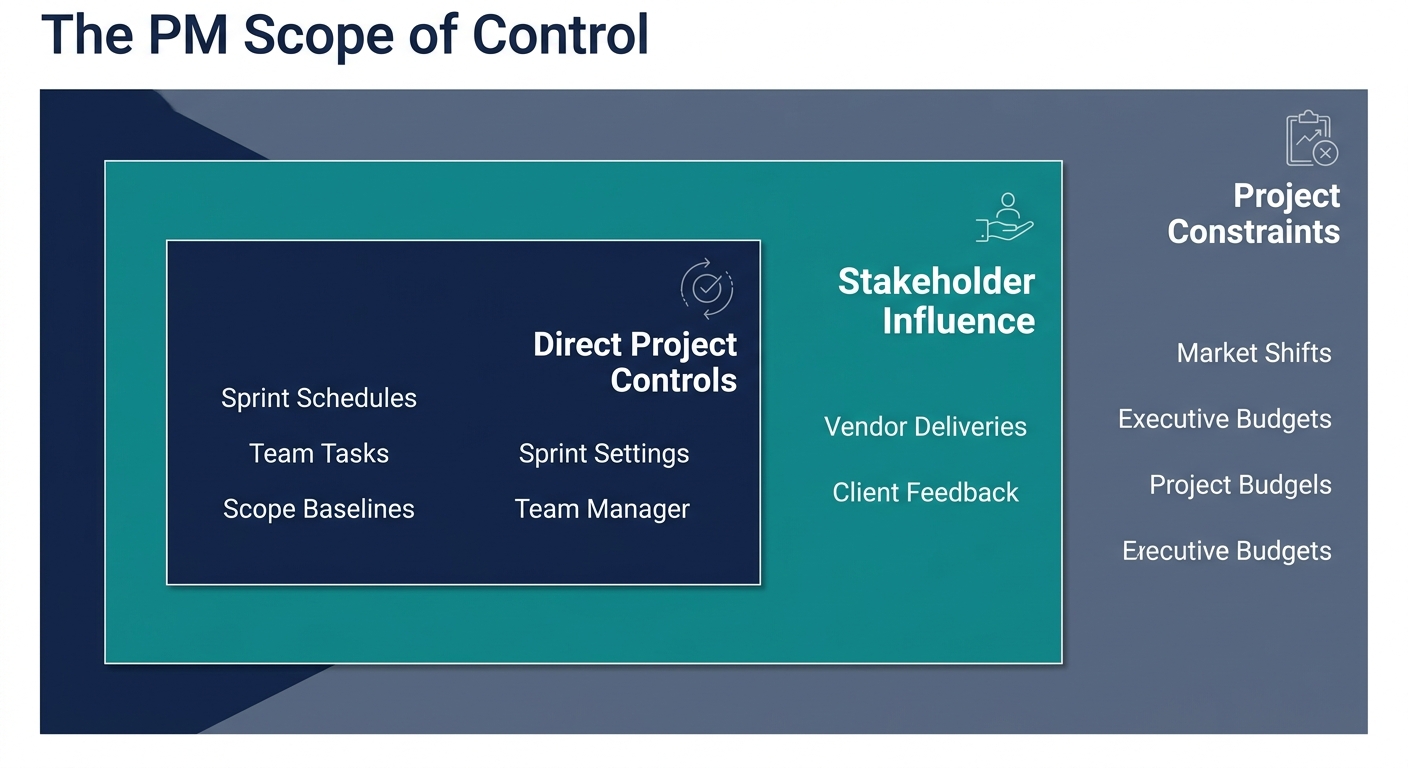
A project boundary is the line between what the project owns and what it must understand but cannot control. Inside the boundary sit the work, the deliverables, the schedule, the budget, the team, and the decisions. These belong to the project manager. Scope definition, which the planning chapters address in depth, is essentially the act of drawing this line with precision. Done well, it tells every stakeholder exactly what the project will produce and what it will not. Done poorly, it is the source of nearly every major project conflict you will encounter. Outside the boundary, but still in the project's circle of concern, sit the forces that can reach in and disrupt: market conditions, regulatory changes, executive priorities, competitor actions, economic shifts. You cannot control any of these. You must absolutely be watching for them.
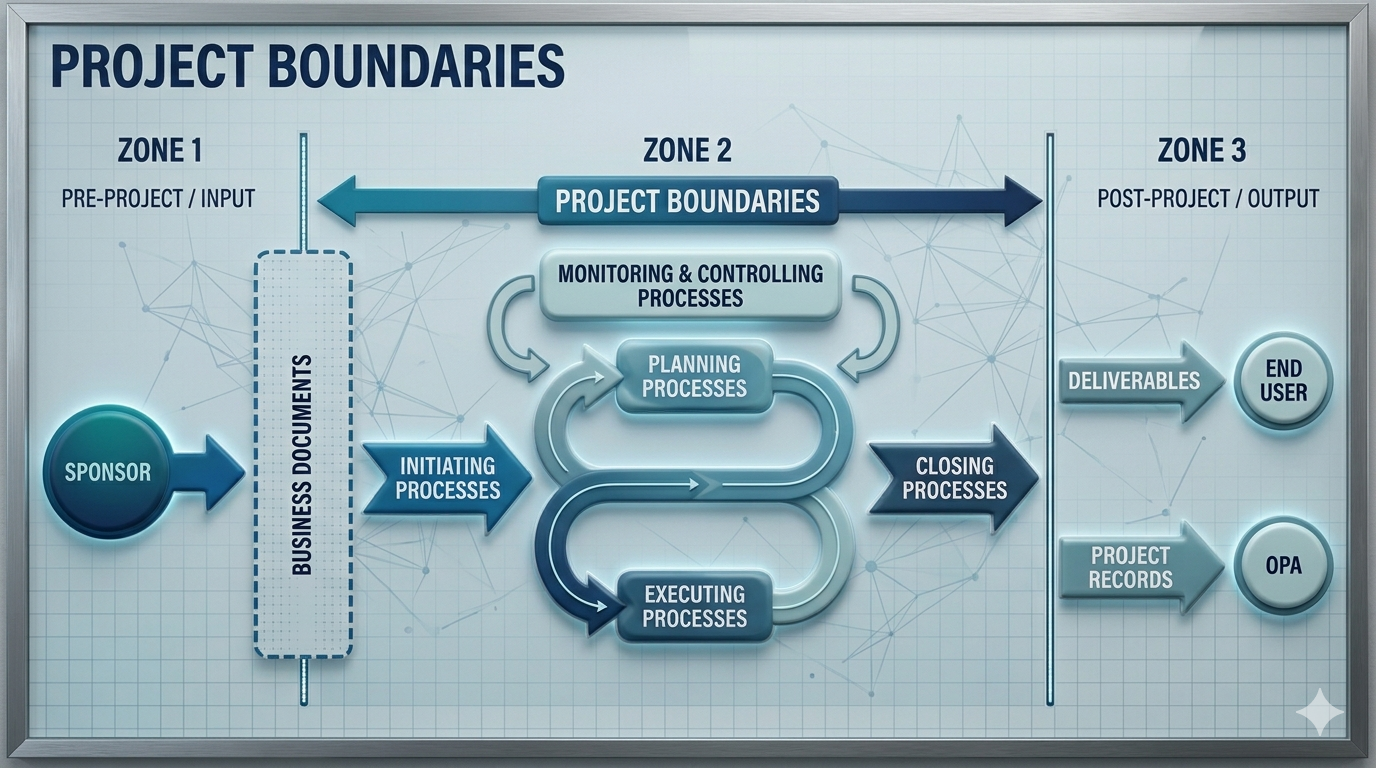
There is also a gray zone on the timeline, the period before the project formally begins. Business cases, feasibility studies, and strategic assessments are often written before a project manager is assigned. Sometimes you inherit them fully formed. Sometimes they are still being developed when you arrive. Either way, they define the expectations your sponsor carries into the project, and those expectations become the measuring stick for every major decision you will make. The project boundary does not begin at a blank slate. It begins with the context those pre-project documents establish. Understanding them before the first planning session is not optional preparation. It is how you avoid spending the first month of a project correcting misaligned assumptions that were baked in before you were involved.
The Business Case — Every Project's Rationale
Projects do not appear randomly. Every project exists because someone expected a benefit: a measurable improvement in the organization's position. The document that captures that reasoning and justifies the investment is the business case. You may not always be the one who writes it. In many organizations, the sponsor or a business analyst creates the business case before you are assigned as project manager. But you will always need to understand it, because it defines what the sponsor expects the project to deliver, and those expectations are the benchmark against which your project will be measured throughout its life.
A well-structured business case follows a predictable pattern. It opens with an executive summary, the short version of the entire argument, written for decision-makers who may only read the first page. It then provides background and context: the problem being solved or the opportunity being captured. From there, it presents alternatives, the options that were considered, along with analysis of each, including the financial case for and against. That alternatives section matters more than many practitioners realize. A business case that presents only one option and recommends it is not a business case. It is a justification. The discipline of evaluating multiple options before selecting one is what separates a decision backed by evidence from a decision made by whoever argued loudest in the room. The financial section also contains the assumptions the analysis rests on, and those assumptions are your first risk inventory. When you read a business case as an incoming project manager, you are not reading it for approval. You are reading it for alignment: extracting the objectives that become your success criteria, verifying the assumptions before they become problems, and understanding the financial expectations your sponsor will compare your performance against throughout the project's life.
When you inherit a business case, check it for these elements before your first planning session:
- The problem or opportunity that justifies the project.
- The alternatives that were evaluated and the reasons they were rejected.
- The recommended option and the rationale for choosing it.
- The expected benefits and how they will be measured.
- The key assumptions the financial projections depend on.
- The known constraints and major risks.
- The sponsor and decision owner.
- The financial expectations the project will be measured against at close.
Imagine being assigned to lead a project called "Assembly Line Performance Upgrade." The assignment arrives as a forwarded email chain: nine people copied, no attachments, no scope, no financials. Buried near the top is a note from what appears to be the sponsor: "I want this project done — it will make the plant viable again." No business case. No formal scope. No defined objectives. No comparison of alternatives. The instinct in this situation is to reply to the email and schedule a kickoff meeting. The more useful move is to stop and identify what you actually need before that meeting has any value. Contact the sponsor's office or the PMO directly and ask for the business case and any related initiation documents. What you specifically need: the comparison of alternatives that led to this particular upgrade being chosen, the financial return or benefit justification, and measurable success criteria. If no formal document exists, help create one. Even a single page that captures the problem, the chosen solution, the alternatives rejected, and the expected outcome gives the project something to stand on. A project that starts without this foundation will face scope creep, misaligned expectations, and a sponsor who cannot explain why they approved it, usually at the worst possible moment.
Return on Investment
Four financial tools test whether the argument a business case makes is sound. In many organizations, the sponsor, a business analyst, or the finance team builds the financial model; the PM does not need to be a finance specialist, but must understand the analysis well enough to question its assumptions and recognize when delivery choices are threatening the promised return. Each tool approaches the same underlying question from a different angle: is this investment worth making? Learning to use them, and understanding what each one cannot see, is a skill that pays off across the entire project life. When a project is struggling and the sponsor is questioning whether to continue, or when a significant scope change is proposed and someone needs to assess whether the modified investment still makes sense, these are the tools that structure that conversation.
Return on investment measures how much financial return a project generates relative to what it costs. Subtract the initial investment from the total expected returns to get net profit, then divide net profit by the initial investment and express the result as a percentage.
A company invests $80,000 in a productivity improvement project and generates $100,000 in cost savings over four years. The calculation breaks down in three steps:
- Net profit: $100,000 total returns − $80,000 investment = $20,000
- ROI: $20,000 ÷ $80,000 × 100 = 25%
- Annualized: 25% ÷ 4 years ≈ 6% per year
That 6 percent per year matters more than the headline 25 percent figure. If a low-risk alternative would deliver a comparable annual return with none of the effort or uncertainty, the project needs to account for that comparison. Context matters as much as the number itself. ROI has two important limitations. First, it treats every dollar of return the same regardless of when it arrives. A dollar received in Year 1 and a dollar received in Year 4 are counted equally, even though the Year 1 return can be reinvested immediately and begin earning further returns. Second, ROI says nothing about how long the organization's capital is at risk. A 25 percent ROI over one year and a 25 percent ROI over five years look identical in the formula but represent dramatically different investment propositions. Payback period addresses the risk-exposure limitation directly.
Payback Period
Payback period answers the question most sponsors ask first: how long until we get our money back? Rather than summarizing returns over a project's full life, it tracks the accumulation of cash inflows year by year until the total matches the initial investment. For projects with even annual cash flows, the formula is simple: divide the initial investment by the annual cash inflow.
For projects with uneven cash flows, the calculation works by accumulation. Track a $100,000 investment in a production machine year by year until the cumulative total crosses the breakeven line:
| Year | Annual Cash Flow | Cumulative Total | Status |
|---|---|---|---|
| 1 | $30,000 | $30,000 | Not yet recovered |
| 2 | $40,000 | $70,000 | Not yet recovered |
| 3 | $50,000 | $120,000 | Investment recovered |
| 4 | $60,000 | $180,000 |
The $100,000 investment is recovered partway through Year 3. At the start of Year 3, $30,000 remained to recover. Year 3 generates $50,000, so payback occurs at exactly 2.6 years ($30,000 remaining divided by $50,000 annual cash flow). Compare that to an alternative with the same investment requiring 4 years to recover: the second option leaves the organization's capital at risk for significantly longer. Payback period functions as a risk indicator as much as a financial metric. An investment that pays back in under two years on a ten-year useful-life asset represents a very different exposure profile than one that pays back in six years on the same asset. But payback has its own blind spot: it ignores everything that happens after the break-even point. Two investments that pay back in two years look identical, even if one generates nothing further and the other generates returns for a decade. Net present value resolves this, but first requires understanding why future money is worth less than money received today.
Why Future Money Is Worth Less
Sam Ewing once wrote that inflation is when you pay fifteen dollars for the ten-dollar haircut you used to get for five dollars, back when you had hair. Accurate, and directly relevant to project financial analysis. Money loses purchasing power over time. A thousand dollars today buys more than a thousand dollars will buy three years from now. That simple reality is the foundation of discounted cash flow analysis, and it changes how every financial projection in a business case should be evaluated.
The erosion of value has two drivers. Inflation reduces purchasing power directly: the same number of dollars buys less as prices rise. But even in the absence of inflation, money available today carries an advantage over money promised in the future. It can be invested now and begin earning a return immediately. Holding $20,000 in cash for a year means giving up whatever that money could have earned elsewhere during that time. At 10 percent inflation or opportunity cost, $20,000 held idle for a year has the purchasing power of roughly $18,000 in real terms. After three years, it is closer to $15,000. The money did not go anywhere. The number on the bill did not change. But what it can buy did. This concept, the opportunity cost of capital, is the reason organizations set a minimum required return on investments. Any project returning less than that threshold is destroying value relative to the alternative uses of the same money.
This reasoning extends directly to project returns. When a business case says a project will return $65,000 in Year 4, that amount is not worth $65,000 in today's money. To make a fair comparison between what you invest now and what you receive later, you translate each future cash flow back to its present value using a discount rate, which is typically the organization's minimum acceptable return or its cost of capital. The mechanics are straightforward: divide each year's cash flow by one plus the discount rate, raised to the power of that year. At a 10 percent discount rate, Year 1 returns are divided by 1.10. Year 2 returns by 1.21. Year 3 returns by 1.331. Year 4 returns by 1.4641. Each additional year adds another compounding layer of discounting, because each year further into the future is worth a little less in today's money.
Net Present Value
Net present value applies discounting to all future cash flows, sums the present values, and subtracts the initial investment. The result tells you whether the project creates value above and beyond the organization's required return, expressed in today's dollars.
A worked example makes the mechanics concrete. A project requires a $200,000 investment and projects $65,000 in annual returns over four years. At a 10 percent discount rate, each year's cash flow is divided by a compounding factor: one plus the rate, raised to the power of that year.
| Year | Cash Flow | Discount Factor (10%) | Present Value |
|---|---|---|---|
| 1 | $65,000 | ÷ 1.1000 | $59,091 |
| 2 | $65,000 | ÷ 1.2100 | $53,719 |
| 3 | $65,000 | ÷ 1.3310 | $48,835 |
| 4 | $65,000 | ÷ 1.4641 | $44,395 |
| Total Present Value | $206,040 | ||
| Less: Initial Investment | ($200,000) | ||
| Net Present Value (NPV) | +$6,040 | ||
What appeared to be a $60,000 nominal profit on paper is worth about $6,000 in today's money. That is what time does to returns. Notice also what the year-by-year figures reveal: the $65,000 earned in Year 1 retains $59,000 of its value. The same $65,000 earned in Year 4 retains only $44,000. Money earned early is worth more because it arrives sooner and can be reinvested. This has a direct message for project managers. Every month a project runs late is a month the organization waits for returns that are simultaneously shrinking in real value. You control the time constraint, and the time constraint is not just a schedule issue. It is a financial one.
A positive NPV means the investment exceeds the required return and creates real value. A negative NPV means the opposite: even if the project generates nominal profit, the returns do not clear the organization's cost of capital. A negative NPV is not automatically a reason to cancel a project. There may be strategic, compliance, or reputational reasons to proceed despite the numbers. But a negative NPV tells the sponsor exactly what they are giving up financially. Presented honestly, that information is useful. Hidden or ignored, it becomes a problem later.
Internal Rate of Return
Internal rate of return, or IRR, completes the set. Where NPV tells you whether a project clears the required return at a specific discount rate, IRR tells you the actual annual percentage return the investment delivers. It is the discount rate at which the project's NPV equals exactly zero.
=IRR() function with Year 0 entered as a negative value representing the initial investment.If a project has an IRR of 18 percent and the organization's cost of capital is 10 percent, the investment clears the hurdle comfortably. If the IRR is 8 percent against a 10 percent hurdle, it does not. Calculating IRR by hand requires trial and error: guess a discount rate, calculate NPV, adjust, and repeat until NPV reaches zero. In practice, Excel's IRR function does this work in seconds. Supply the year-by-year cash flows with Year 0 entered as a negative value representing the initial investment, and the function returns the IRR directly. IRR is particularly useful when comparing investments of different sizes. Rather than comparing absolute NPV dollars (which naturally favor larger investments), IRR expresses efficiency as a percentage that can be compared across options regardless of scale.
Using All Four Tools Together
One caution applies to all four tools: they do not remove uncertainty from investment decisions, they discipline it. A precisely calculated NPV built on weak cash-flow estimates or an optimistic discount rate is still weak analysis. The most useful thing you can do with any financial model is question the assumptions it is built on before accepting the output. The four tools address different questions and work best when used in combination. ROI gives you a percentage return quickly but treats time too simply. Payback tells you when you get your money back but ignores everything that happens after break-even. NPV brings in the time value of money and gives you a dollar figure in today's terms, the most complete read of actual value created. IRR converts all of that into an annual percentage, so you can compare investments of different sizes on the same scale. Run all four and look at what they collectively reveal.
When the four tools point in the same direction, the decision is clear. When they disagree, that disagreement is information, not a flaw. It tells you which question matters most for this particular investment. Payback and IRR both favor capital efficiency: lower investment, faster recovery, higher percentage return per dollar. NPV favors total value creation: which option generates the most economic value over the full analysis period, even if it requires a larger initial outlay. Whether the organization is optimizing for speed of capital recovery or magnitude of long-term value is a strategic choice, not an arithmetic one. The tools surface that question. Leadership must answer it.
Robert the Renovator is a renovation and maintenance company with $2.4 million in annual revenue, 150 staff, and a solid residential client base. Leadership identified a growth opportunity in commercial maintenance, but the current office is on the wrong side of the city. In commercial work, response time is a competitive weapon: the company that arrives fastest wins repeat calls, and repeat calls convert into service agreements and eventually into renovation contracts. Three relocation alternatives were evaluated. Alternative A moved the entire operation to a midpoint location: conservative, preserving residential reach while improving commercial response times. Investment: $180,000. Alternative B moved entirely into the commercial district, the bolder bet, with dramatically faster commercial response and strong brand visibility in the target market. Investment: $200,000. Alternative C kept the residential office and opened a dedicated commercial branch. Same $200,000 investment as Alternative B, but with significant operational overhead and a slightly negative Year 1 cash flow during the ramp-up period.
The financial model used a four-year horizon and a 10 percent discount rate. The results across all three tools:
| Alternative | Investment | Payback | NPV | IRR |
|---|---|---|---|---|
| A: Midpoint location | $180,000 | 1.32 yrs | ~$268,000 | 67.7% |
| B: Commercial district | $200,000 | 1.40 yrs | ~$298,000 | 65.4% |
| C: Branch office | $200,000 | 2.77 yrs | ~$89,000 | 23.9% |
Alternative C is the one worth pausing on: it requires the same $200,000 investment as Alternative B but produces less than a third of the NPV, with more complexity and a slower payback. Payback and IRR slightly favored Alternative A. NPV clearly favored Alternative B. This is not a flaw in the analysis. It is the tools doing exactly what they should, each asking a different question. Robert the Renovator's strategic goal was not capital efficiency. It was maximizing commercial growth value over time. NPV is the right primary measure for that question, and Alternative B won it clearly. Alternative A was retained as the sensible fallback if capital became constrained. Alternative C was deferred: the concept may have merit later, but the financial case for waiting is stronger than the case for acting now.
Choosing Between Alternatives — Decision Trees and the Balanced Scorecard
The four financial tools work well when the cash flow projections are reasonably reliable. Two additional tools help decision-makers handle situations where uncertainty is high or where value cannot be fully captured in cash flow projections. Decision trees handle uncertainty by making the probability assumptions explicit. The balanced scorecard handles strategic value by adding non-financial dimensions to the financial ones.
A decision tree maps out a choice as a branching diagram. At each branch point, you define the possible outcomes and the probability of each. Multiplying each outcome's value by its probability produces an expected monetary value, or EMV. Summing the EMVs and subtracting the option's cost gives a single number representing the risk-adjusted net value of that decision path. Consider a manufacturing team evaluating two options: buy a new robotic cell for $100,000, or repair the existing one for $50,000.
Option A: New robotic cell ($100,000 investment)
| Outcome | Probability | Value | Weighted Value |
|---|---|---|---|
| High productivity | 70% | $200,000 | $140,000 |
| Lower productivity | 30% | $120,000 | $36,000 |
| Gross Expected Value | $176,000 | ||
| Less: Investment | ($100,000) | ||
| Net EMV | $76,000 | ||
Option B: Repair existing machine ($50,000 investment)
| Outcome | Probability | Value | Weighted Value |
|---|---|---|---|
| High productivity | 80% | $110,000 | $88,000 |
| Lower productivity | 20% | $75,000 | $15,000 |
| Gross Expected Value | $103,000 | ||
| Less: Investment | ($50,000) | ||
| Net EMV | $53,000 | ||
Without the tree, the instinct is often to choose the cheaper option. With it, you can show precisely why the more expensive path delivers $23,000 more in expected value once outcomes and their probabilities are taken seriously.
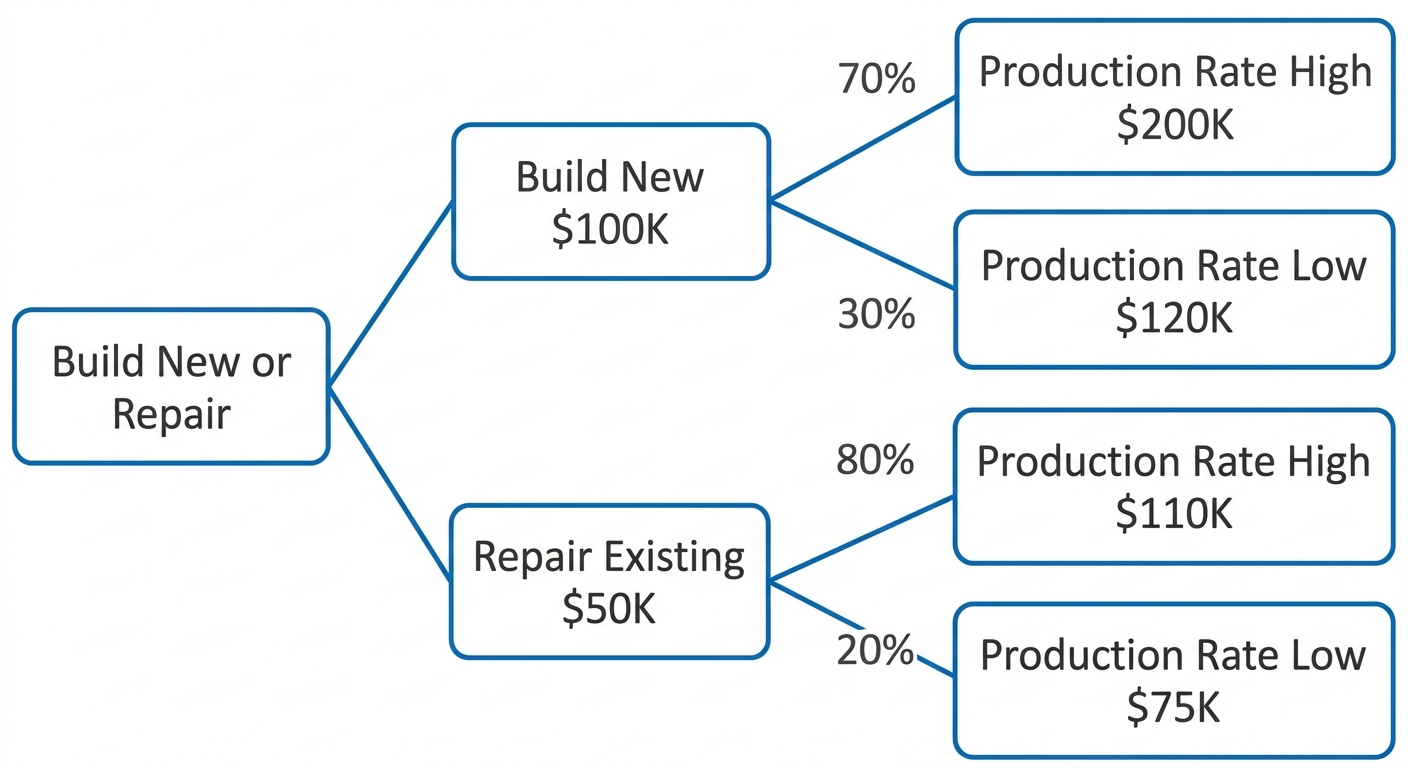
The decision tree is only as good as the probability estimates used. Those estimates come from market research, historical data, or expert judgment. If the 70 percent confidence is actually closer to 50 percent, the answer changes. The tree does not deliver certainty. It structures the uncertainty, so that decision-makers are agreeing on the assumptions rather than arguing from different unstated beliefs. That alone is valuable. Teams that build a decision tree together must commit to probability estimates and defend them. The conversation that surfaces is almost always more useful than a decision made without it.
Some project benefits resist financial quantification. A project that builds internal capability, improves customer experience, or positions the organization for future growth creates real value that does not always appear clearly in a cash flow model. The balanced scorecard addresses this by evaluating a project's impact across four perspectives: financial outcomes, customer impact, internal process improvement, and organizational learning and growth. Applied to project selection, it allows decision-makers to rate alternatives across all four dimensions, not just financial return. An option that scores well financially but poorly on strategic capability-building may look less attractive when the full picture is visible. The scorecard brings strategic intent into the same room as the spreadsheet and forces a more complete conversation about what the organization is actually trying to achieve.
 V2.png)
The tools covered in this section — ROI, payback period, NPV, IRR, decision trees, and the balanced scorecard — inform the project selection decision. They do not make it. In most mature organizations, a formal governance process determines which projects receive funding and in what priority order, typically through a portfolio review board, project steering committee, or investment committee that evaluates financial performance against strategic fit and organizational capacity. Understanding how your organization makes these decisions matters: the financial case you build for a project is an input to a broader governance conversation, and the strength of that case determines how far it advances through the selection process.
What Benefits Actually Look Like
When people think about project benefits, they usually picture revenue growth. But the range of legitimate project benefits is far wider than that, and naming the type of benefit clearly is one of the first disciplines of benefit management. Some projects are driven by regulatory compliance: do it, or face fines, lose licenses, or breach legal obligations. The benefit is not revenue. It is risk avoidance, and the cost of non-compliance is the benchmark against which the project's investment is measured. Others are driven by technology shifts: adopt the new platform now or become uncompetitive as the ecosystem moves without you. Internal process improvement projects may not generate new revenue directly but reduce waste, errors, or cycle time in ways that appear in margins over time. Employee retention is a legitimate benefit: a project that reduces turnover by 15 percent avoids real recruitment and training costs, even if those costs are hard to see on a single income statement line. Brand positioning and competitive visibility matter to organizations that depend on being chosen from a crowded field. Risk reduction projects lower the probability of costly incidents: a safety improvement project may never show a direct return, but the losses it prevents can be enormous.
The reason it matters to name the type of benefit precisely is that different benefit types require different measurement approaches and different accountability structures. A revenue-growth benefit is tracked through sales pipeline data and booking rates. A compliance benefit is tracked through audit results and regulatory reports. A risk-reduction benefit is tracked through incident rates and near-miss frequencies. A benefit labeled generically as "strategic" and left at that is almost impossible to measure, and unmeasured benefits are the first casualty when execution pressure mounts and attention narrows to schedule and budget. The sponsor who approved the project on the promise of strategic value has no way to know whether the project delivered it. That ambiguity tends to surface as conflict at project close, when it is too late to do anything about it.
Benefit Management
A project that delivers its scope on time and within budget has not necessarily succeeded. Success depends on whether the outcome delivers the benefit that justified the investment. Benefit management keeps that distinction visible throughout the project's life, not just at approval and again at close. The business case documents the expected benefit. The sponsor is accountable for that benefit: they own the decision to invest, they own the expected return, and they are responsible for keeping the business case current as circumstances change. The project manager's accountability is different but equally important: to raise the flag when project decisions are putting the expected benefit at risk, and to ensure the deliverables being produced are genuinely aligned with the benefit they are supposed to enable. Completing an output and producing an output that enables the organization to realize the return the business case promised are not the same thing. The first is delivery. The second is value.
Benefits are not always fixed, and acknowledging that matters. Sometimes a project uncovers an opportunity that was not anticipated at the outset: a positive risk that expands the potential return, an unexpected market shift that makes the project more valuable than originally projected, a technology advancement that opens a new application for the project's deliverables. When that happens, the benefit management plan should be updated to reflect the new reality. Benefit management is not only about protecting the downside. It is equally about recognizing when the upside has grown and adjusting the project's success criteria accordingly. Benefits can also shift in shape without changing in scale: a cost-reduction project might evolve toward a capability-building project as the environment changes. The project may still serve the organization's goals, but knowing that those goals have shifted is what allows you to confirm the project remains genuinely aligned with them and not just with the original version of the plan.
Your Project's Environment
A project does not operate in isolation. It lives inside an organization, and the organization lives inside a broader environment composed of market conditions, regulatory frameworks, economic forces, and cultural dynamics that reach in and affect the project whether you account for them or not. These conditions divide into two categories: internal and external. In formal project management standards, they are called Enterprise Environmental Factors, but the label matters less than the habit of accounting for them before the plan is set.
Internal conditions are the realities inside your organization that you cannot directly control. The organizational structure, whether functional, matrix, or projectized, determines how much authority you have and how easily you can secure resources and decisions. Culture shapes how your team behaves under pressure: how decisions get made, how conflict surfaces, how leadership communicates when things go wrong. Infrastructure, which includes the tools, systems, facilities, and technologies your project will use, sets the ceiling on what is possible and how fast you can realistically move. You do not design these conditions. You work within them and factor them into your planning from day one. A project manager who ignores internal organizational conditions tends to plan for the organization they wish they worked in rather than the one they actually do. The result is a plan that looks sound on paper and falls apart in execution.
External conditions are forces outside the organization that can reach in and affect your project. Marketplace conditions, including competitor moves, economic shifts, and changes in customer behavior, can invalidate assumptions the business case made at approval. Regulatory and legal requirements can change mid-project, particularly for organizations operating internationally or in heavily governed industries. Cultural and social conditions matter for projects involving change management or public-facing outcomes. Financial factors such as exchange rates and inflation affect long-duration budgets and international projects in ways that compound over time. The practical discipline is this: when planning, list the environmental assumptions your project depends on explicitly. When executing, monitor them. When one changes, do not absorb it quietly into the schedule. Surface it, assess the impact, and brief your sponsor. Awareness of what lies outside the project boundary does not mean responsibility for it. It means you will not be surprised by it at the worst possible moment.
Your Organization's Knowledge Base
Every organization that has been running for more than a few years has accumulated a body of knowledge: templates, documented processes, historical project data, lessons learned from past work, approved vendor lists, and estimating benchmarks built from actual project performance. This accumulated knowledge represents the experience of everyone who worked in that organization before you. When you join a project and find a standardized charter template, a risk register format, or an archive of similar past projects to draw estimates from, you are benefiting from work someone else built and maintained. Formal standards call these Organizational Process Assets, but the point is simpler: your organization has already solved many problems you are about to face. Find that knowledge before reinventing it.
The practical value of this organizational knowledge is significant and often underestimated. An organization that has completed dozens of similar projects has data on how long certain activities actually take as opposed to how long they were estimated to take. It knows which risks reliably materialize, which vendor relationships hold under pressure, and how much contingency is genuinely needed as opposed to how much was optimistically left out of the last estimate. A construction company that has built hundreds of homes has checklists for every phase of the work, inspection forms refined through real situations, and client sign-off processes shaped by the moments where they were first needed. Starting from that accumulated knowledge is faster, more accurate, and less error-prone than starting from scratch. Your first task when entering any new organization is to find out what documented knowledge exists and use it.
The flow works in both directions. You draw on organizational knowledge as an input to your project, but your project generates knowledge that becomes an input for future projects. The lessons learned document you produce at closing helps the next project manager running something similar. The actual cost data you capture throughout execution feeds the organization's estimating database. The risk responses you developed and tested contribute to the organization's knowledge of how to handle that category of risk the next time it appears. This is not optional record-keeping. It is professional stewardship. The organization's project management capability improves one project at a time, and every project manager who takes documentation seriously makes the next one's job measurably easier. Be the project manager who leaves the organization's knowledge base better than you found it.
A project manager with years of experience inside their own organization accepts a contract role leading an internal project for a long-standing client. On the first day, sitting at a desk in the client's office, the realization lands: none of the familiar tools apply. The charter template, the risk register format, the estimating data, the vendor relationships: all of it belongs to the home organization, and this project belongs to the client's. The key word in Organizational Process Assets is organization. Because the project operates under the client's authority and governance, their OPAs will shape how it is documented, approved, and reported. The right first move is not to import familiar templates from the home organization. It is to contact the client's PMO and ask what templates they use, what approval processes they follow, what governance standards they expect, and what historical data they maintain. If their charter template is less detailed than what you are used to, adapt. If their risk process is lighter than yours, flag the gaps professionally and work within their system while making your concerns known. And at the end of the project, contribute back. Write a thorough lessons-learned document in their format, for their repository. Update their estimating data with the actuals from your engagement. A professional who works in someone else's house is still responsible for improving it.
Tailoring Your Approach
Everything covered in this chapter, project boundaries, business cases, financial analysis tools, organizational conditions, and the organization's accumulated knowledge, is part of a large and well-developed body of project management knowledge. Not all of it applies to every project in the same way, and applying it uniformly regardless of context is as much a mistake as ignoring it entirely. A three-week internal IT fix does not need the same governance structure as a two-year infrastructure program. A five-person team running a low-risk administrative project does not require the same documentation rigor as a regulated financial services initiative with external stakeholders and contractual obligations. Tailoring is the discipline of choosing the right tools for the project in front of you and adapting them to fit the specific context rather than applying a methodology uniformly and hoping it fits.
Several factors determine how a project should be managed. Complexity and scale are the most obvious: larger projects with more stakeholders and longer timelines need more structure, not less. Risk profile matters: a high-stakes, high-uncertainty project warrants rigorous risk planning in a way that a low-risk, well-understood project does not. Organizational culture plays a role. An environment that values speed and flexibility will resist heavy documentation requirements, and pushing against that culture produces bureaucratic overhead rather than better outcomes. Regulatory requirements may mandate certain processes regardless of preference. The experience level of the team also affects how much scaffolding they need versus how much autonomy they can handle effectively. Tailoring is not guesswork, and it is not a license to skip things because they feel inconvenient. It is a deliberate assessment of these factors and a conscious decision about which practices to apply fully, which to simplify, and which to defer until they are genuinely needed.
| Factor | Use more structure when... | Use lighter structure when... |
|---|---|---|
| Risk | Failure is costly, visible, or difficult to reverse | Impact of failure is contained and recoverable |
| Stakeholders | Many groups with competing interests can block success | Few decision-makers, aligned on outcome |
| Regulation | External compliance requirements apply | No formal compliance burden |
| Uncertainty | Requirements are unclear or likely to change | Work is well-defined, familiar, and repeatable |
| Team experience | Team is new to this type of work or distributed across locations | Team is experienced, co-located, and has worked together before |
Early in a project management career, the tendency runs in one of two directions: applying everything regardless of fit, which creates overhead and rigidity that slows the work, or skipping things because they feel like unnecessary process, which creates gaps that surface at the worst possible moment. What develops over time is a calibrated sense for what each specific project actually needs. That judgment is one of the most valuable things an experienced project manager brings to an engagement, and it cannot be acquired by reading a methodology. It develops through practice, through honest reflection on what worked and what did not, and through the willingness to hold yourself accountable for results rather than for process compliance. The goal is never to impress anyone with how many steps you followed. The goal is a delivered outcome that served the organization's investment.
What's Next
The next chapter examines the project manager's role specifically: what the job actually demands beyond task coordination, the competencies that distinguish strong practitioners from those simply going through the process, and how leadership, communication, and influence operate in an environment where the project manager rarely controls the people they depend on.
Reflect
- Think about a project investment decision you have seen made in your organization. Which financial tools were used, and which were missing? How might the decision have looked different with a more complete analysis?
- Identify one internal organizational condition and one external factor that affected a project you have been part of. Was either anticipated, or did they surface as surprises?
- What documented knowledge, templates, or process standards does your current organization maintain for use across projects? Are there gaps that create repeated problems from project to project?
- Think about a project you have managed or observed. Was the approach tailored to the actual complexity and risk of the work, or was a standard methodology applied regardless of fit? What was the result?
How To Land the Job and Interview for Project Managers Course
Take the next big step in your project management career with HK School of Management. Whether you're breaking into the field or aiming for your dream job, this course gives you the tools to stand out, impress in interviews, and secure the role you deserve.
This isn’t just another job-hunting guide—it’s a tailored roadmap for project managers. You’ll craft winning resumes, tackle tough interview questions, and plan your first 90 days with confidence. Our hands-on approach includes real-world examples, AI-powered resume hacks, and interactive exercises to sharpen your skills.
You'll navigate the hiring process like a pro, with expert insights on personal branding, salary negotiation, and career growth strategies. Plus, downloadable templates and step-by-step guidance ensure you're always prepared.
Learn from seasoned professionals and join a community of ambitious project managers. Ready to land your ideal job and thrive in your career? Enroll now and take control of your future!

Build complete project plans in minutes with AI
Stop spending hours on documentation. Learn how to use AI to create charters, WBS, schedules, risk registers, and executive reports faster—while staying fully in control. This course gives you ready-to-use prompt templates and practical workflows based on real project work. No guesswork, no fluff—just tools you can apply immediately. Backed by Udemy’s 30-day money-back guarantee, so you can start risk-free.
Learn More