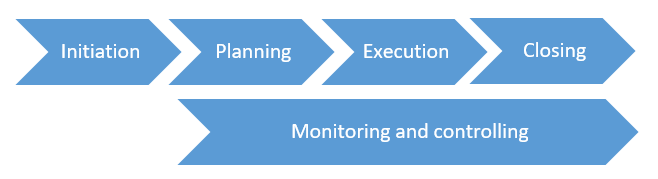
Monitoring and Controlling Foundations
Why Projects Fail After They Start
Most projects don't fail in execution. They fail because nobody noticed execution going wrong until it was too late to do anything about it. The schedule slipped three weeks before anyone raised a flag. The budget crept past the baseline before anyone ran the numbers. A vendor fell behind quietly while the team assumed everything was on track. By the time the problem surfaced, the project had absorbed costs it couldn't recover and missed windows it couldn't reopen. The gap between what is actually happening on a project and what the project manager believes is happening is one of the most expensive gaps in project management. Monitoring and controlling exists specifically to close it.
Monitoring and controlling is not a single activity, and it is not something that waits until a problem appears. It is a continuous discipline that runs alongside execution from the first day of project work to the last. While the team is building deliverables, the PM is tracking performance against the plan, identifying variance, and deciding what to do when things diverge from expectations. The two activities run in parallel, and that parallel relationship is the most important structural feature of this phase to understand before getting into the tools and processes within it.
A Parallel Activity, Not a Sequential Phase
A common misconception about monitoring and controlling is that it happens after execution, as a kind of review or wrap-up. It does not. From the moment the team begins doing work, the project should also be actively measuring that work, comparing results to the plan, and responding to anything that falls outside acceptable range. Think of it the way a pilot thinks about flight instruments. The pilot doesn't fly the plane and then check the instruments afterward. The gauges are watched continuously, and what they show determines what adjustments get made in real time. Execution is the engine of the project. Monitoring and controlling is everything on the dashboard, running the whole time the engine is on.
This parallel structure has a practical implication for how the PM spends time during execution. Up through planning, most PM effort goes into creating things: a charter, a schedule, a budget baseline, a risk register. During execution, the focus shifts to making the work happen. Monitoring and controlling adds another layer on top, formally measuring whether what is happening matches what was planned, and deciding what to do when it doesn't. The PM role shifts from builder to guardian. The plans built so carefully during planning are now being tested against reality, and the PM's job is to protect the schedule, budget, and scope while those tests play out.
How Information Travels Through a Project
There is a specific pathway that information follows in monitoring and controlling, and understanding that pathway is more useful than memorizing any individual technique within it. Raw observations from the project, hours logged by team members, tasks completed, problems raised, are called work performance data. At this stage the data is unanalyzed. A team member logging twelve hours against a task estimated at eight is work performance data. It is a fact, and it means nothing yet.
Work performance information is what happens when that raw data gets analyzed against the project plan and baselines. The twelve hours against an eight-hour estimate, combined with the task being forty percent complete rather than finished, produces something meaningful: a cost overrun, a schedule slip, a productivity gap. That is information, and it is what the PM works with when making decisions. Work performance information then gets packaged and communicated to the stakeholders who need it. The status report that goes to the steering committee, the dashboard the sponsor reviews weekly, the summary at the progress meeting, these are work performance reports. The same underlying facts, processed three different ways for three different purposes. The PM lives in the middle of this pipeline, turning raw data into decisions before it becomes a report.
| Stage | What It Is | Example |
|---|---|---|
| Work Performance Data | Raw facts from the project — unanalyzed | 12 hours logged; task reported 40% complete |
| Work Performance Information | Data analyzed against the baseline — meaning extracted | 4-hour cost overrun; task 3 days behind schedule |
| Work Performance Report | Information packaged for stakeholders — decision-ready | Weekly status report; sponsor dashboard; variance summary |
Twelve Processes, One Logic
Monitoring and controlling covers twelve distinct processes, each focused on a different area of the project: scope, schedule, cost, quality, resources, communications, risk, procurement, and stakeholder engagement. The list sounds heavy when you see it laid out in full. In practice, the logic running through all twelve is identical. You set a baseline during planning. You measure actual performance against that baseline during execution. When variance appears, you analyze it and decide what to do: accept it, correct it, escalate it, or raise a change request. That cycle (plan, measure, compare, act) repeats continuously across all twelve areas simultaneously, which is why experienced project managers develop a monitoring rhythm rather than treating each area as a separate effort requiring separate attention. The rhythm is the same. The subject matter differs.
It helps to see the twelve processes as four natural groups rather than twelve separate tasks:
| Group | What It Covers | Processes |
|---|---|---|
| Integration | Overall project health; change decisions | Monitor and Control Project Work; Integrated Change Control |
| Baselines | Scope, schedule, and cost performance against approved targets | Validate Scope; Control Scope; Control Schedule; Control Costs |
| Delivery Health | Quality of outputs; team and physical resource availability | Control Quality; Control Resources |
| Relationships and External Exposure | Communications effectiveness; risk posture; vendor performance; stakeholder engagement | Monitor Communications; Monitor Risks; Control Procurements; Monitor Stakeholder Engagement |
The Umbrella Process
Among the twelve monitoring and controlling processes, one functions as the integrating center: Monitor and Control Project Work. While the other eleven each focus on a specific dimension, this process takes the view across all of them simultaneously. It reads all the gauges at once rather than watching any single instrument. Every other monitoring and controlling process feeds into it at some level, and the outputs it produces drive much of what happens next on the project.
What Monitor and Control Project Work does at a practical level is convert work performance data into decisions. The team reports status. That status gets analyzed against the baselines. The PM determines where the project stands, where it is slipping, and what direction it is trending. Three key outputs come from this analysis regularly. Work performance reports package everything into the form that stakeholders need, whether that is a steering committee briefing, an executive summary for the sponsor, or a detailed variance analysis for the project board. Change requests are raised when a variance is significant enough to require a formal adjustment to the project management plan. Cost and schedule forecasts update the estimates of where the project will finish based on current trajectory rather than original assumptions. These three outputs keep the project visible and manageable, and they are the primary mechanism by which the PM communicates what is actually happening versus what was planned.
The Issue Log as a Diagnostic Tool
One output that deserves its own attention is updates to the issue log. As the project is monitored, issues surface: problems that have already materialized and require a decision or action. The risk register tracks threats that might happen in the future. The issue log tracks what has already happened and needs to be resolved. It captures each issue, assigns an owner, records the target resolution date, and tracks progress to closure. A well-maintained issue log is both a management tool and a diagnostic one. When the PM reviews it regularly and looks for patterns, structural weaknesses become visible. The same type of problem appearing repeatedly points to something deeper. The same team or area generating issue after issue raises a different kind of question about resources, process, or dependencies in that part of the work.
| Field | Purpose |
|---|---|
| Issue description | What has already happened — not a risk, a fact |
| Owner | The specific person driving resolution |
| Date raised | When it surfaced — used to track how long issues stay open |
| Target resolution | When action is needed — creates accountability |
| Status | Open, in progress, escalated, or closed |
| Impact | Which constraint is affected: scope, schedule, cost, quality, or stakeholder trust |
The issue log is also an escalation discipline. Not every issue requires PM-level intervention, and not every PM-level issue can be resolved within the PM's authority. The project governance structure defines what gets handled at which level. The issue log is where escalation decisions get documented and tracked, so nothing falls into the gap between acknowledging a problem and acting on it. Issues that sit without an owner or a resolution path are the ones that become expensive. The log makes that gap visible before it becomes critical.
Eight weeks into a fourteen-week data migration project, the delivery lead surfaced a problem: the database migration script, due the previous Friday, was ten days behind where it needed to be. The team was experienced and self-directed. Weekly standups had been brief and positive. The PM had been managing the stakeholder group and keeping the sponsor updated. Nothing had seemed wrong.
When the PM sat down with Jamal, the developer who owned the migration script, the timeline emerged. In week six, Jamal had hit a permissions issue in the test environment. He spent three days trying to work around it before involving IT. IT took five days to respond. By the time the fix came through, he was already a week behind and couldn't catch up while managing his other tasks. He hadn't flagged it because he expected to resolve it before it became visible.
The project tracking tool told the same story, though no one had read it that way. Jamal's task had shown no progress update for nine days. His logged hours were higher than estimated for the work completed. He had mentioned working through some issues at two consecutive standups. Nothing was in an issue log, because there wasn't one. The data was there. No system existed to turn it into a signal.
The more significant realization was not the IT response-time problem. It was that the project had been running eight weeks without a structured monitoring cycle. Jamal's situation was what happens when there is no formal expectation to surface blockers, no place to record them when they appear, and no regular check against the schedule to notice when tasks go quiet for too long. Before the next standup, the PM created an issue log and added one standing question to every weekly check-in: anything blocked or pending for more than two days that has not been escalated? Not to audit judgment calls, but because invisible blockers stop being manageable. A ten-minute weekly pass through task progress against the schedule was added as well, run every Friday. By week ten, the log had four entries from three different team members. Two were resolved the same week they were raised. None went nine days unnoticed.
Monitoring With Intent
The word "monitoring" can suggest something passive, watching and waiting for something to happen. Effective monitoring and controlling is not passive. Think of the way a hospital intensive care unit monitors patients. Vital signs are tracked continuously. Most readings confirm that things are within normal range. But the system is designed so that when something moves outside that range, a trained response follows immediately. The value is not in the readings that confirm everything is fine. The value is in the system that catches the reading that isn't, immediately, while there is still time to act.
The PM's job in monitoring and controlling is to define what "normal range" looks like for the specific project, what variance is acceptable, what triggers a flag, and what response follows each flag. Most of what gets monitored will confirm the project is on track, and that confirmation is genuinely useful. It means attention stays where problems are actually developing rather than being spread uniformly across the whole project. Monitoring and controlling is the system that makes noticing part of the PM's job. It gives the PM the data pipeline to see what is actually happening, the issue log to capture what needs resolving, and the escalation path to bring in support when the situation calls for it. Projects that close cleanly almost always had it running. Projects that overran almost always did not.
Defining thresholds is what separates active monitoring from passive observation. Without thresholds, everything gets equal attention, which means nothing gets appropriate attention. Common examples: a schedule task more than two working days late warrants a check-in; any critical-path activity slipping at all warrants immediate action; a cost variance above five percent on a work package warrants analysis before it compounds; an issue sitting open for more than one reporting cycle without owner action warrants escalation; a top-risk response that is overdue warrants a risk review meeting. These are not universal rules. They are starting points that get calibrated to the project's size, risk, and sponsor expectations during planning, before execution begins.
| Cadence | What to Check |
|---|---|
| Daily (lightweight) | Blocked work; urgent issues surfaced by team; vendor exceptions |
| Weekly | Schedule progress against baseline; actual vs. budgeted cost; issue log review; top risk status; open change requests |
| Before each milestone | Acceptance criteria readiness; dependencies confirmed resolved; resources confirmed available; stakeholder sign-off scheduled |
| Monthly or at phase close | Forecast updates (schedule and cost); stakeholder engagement check; communications effectiveness; lessons log entries |
What's Next
The next chapter, Integrated Change Control, addresses the process that sits at the center of all monitoring activity: what happens when monitoring reveals that the project needs to change. How change requests get assessed, how decisions get made with proper authority, and why the PM's role in that process is analyst rather than gatekeeper.
Reflect
- On a recent project, how long did it typically take for a problem in execution to reach the PM's attention? What mechanism surfaced it, and what would have surfaced it sooner?
- Think about the distinction between work performance data and work performance information. Where in your current reporting cycle does raw data get analyzed into something meaningful, and who does that analysis?
- If your project has an issue log, when was it last reviewed in a meeting, and how current is it? If there is no issue log, what mechanism currently serves the same purpose?
- What is your current monitoring cadence? Is there a standing weekly check against the schedule baseline, or does the PM learn about slippage from standup summaries?
Project Management with AI: From Initiation to Closing
Build a practical project management process from initiation to closing with our Project Management: From Initiation to Closing with AI course. Learn how to move from informal project coordination to a structured, repeatable approach using PMBOK-aligned workflows, real examples, and professional templates.
This hands-on course follows a complete project lifecycle. You will learn how to write a project charter, define scope, build a work breakdown structure, develop a schedule, estimate costs, manage risks, engage stakeholders, execute the work, monitor performance, and close the project properly.
You will also learn how to use AI tools to accelerate project management work. The course includes reusable prompts, downloadable templates, assignments, and worked examples that show how project documents connect from one stage to the next.
The course is designed for professionals, team leads, coordinators, analysts, and new project managers who need practical skills they can apply at work. Enroll now and build the confidence to manage projects with structure, clarity, and control.
Advance your Lean Six Sigma expertise!
HK School of Management helps you take Lean Six Sigma to the next level—without the overwhelm. Master advanced statistical tools, Excel-based analysis, and real-world improvement techniques to solve complex problems with confidence. For the price of lunch, you get practical templates, guided examples, and hands-on project experience you can use immediately at work. Backed by our 30-day money-back guarantee—zero risk, real impact.
Learn More