Risk Analysis: Qualitative and Quantitative
Two Registers, Two Conversations
Picture two versions of the same risk register on the morning of a project status meeting. The first has thirty-two risks listed in the order they were identified: the one about vendor access sits next to the one about regulatory timelines, which sits next to an opportunity about a new supplier relationship. Nobody can tell at a glance where the real exposure is. The second register is identical in content but sorted by score. The top entry is a threat rated 16 out of 25. It has a named owner. It says "awaiting strategy implementation." Every person in the room knows within ten seconds what this meeting needs to address. Qualitative risk analysis is what turns the first register into the second.
What Qualitative Analysis Actually Does
Qualitative analysis does not predict whether a risk will happen. It does not produce a modeled probability distribution or a precise expected dollar exposure. That is full quantitative analysis, and most projects do not need it. What qualitative analysis does is assign each risk a relative priority by asking two questions: how likely is this, and how bad would it be if it occurred? Multiplying those two assessments produces a score. The score makes the register sortable. A sorted register tells the project manager where to focus response planning, which risks need active monitoring, and which ones can stay documented but unattended for now. Without those scores, the register is a list of concerns. With them, it is a planning instrument.
Why Five Points Beat Three
A three-by-three matrix has nine cells but only six unique multiplication scores: 1, 2, 3, 4, 6, and 9. In practice, many risks cluster in the middle. A risk rated Medium probability and Medium impact scores 4, while one rated Low probability and High impact scores 3. The numbers separate, but only slightly, and two risks with similar scores can hide very different profiles. A five-by-five matrix has 25 scoring cells and a much wider spread of values, even though some combinations still share the same product. The same two risks now separate clearly: Unlikely probability and High impact scores 8, while Possible probability and Medium impact scores 9. The additional precision forces the team to make a sharper judgment on each risk, and the resulting spread makes it possible to sort the register into genuinely distinct priority tiers.
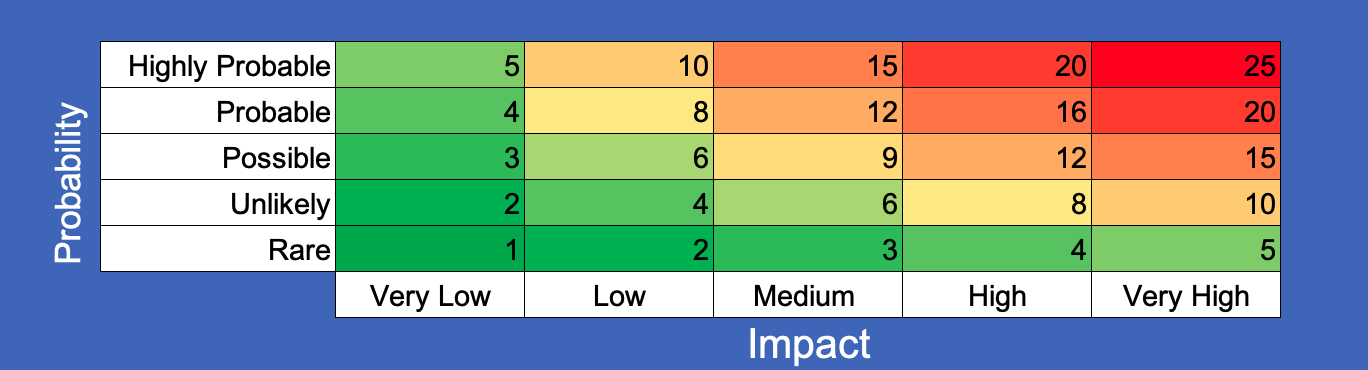
Building a Calibrated Scale
The matrix is only useful if the team shares the same definition of each level. Without calibration, one person's Probable is another's Possible, and the same risk ends up at a score of 9 or 16 depending on who assesses it. Before any risk is scored, the team should define what each probability level means in terms of the project's specific characteristics: how many times similar projects have encountered this type of risk, what conditions would make occurrence more or less likely, and what the realistic range of probability looks like given what the team currently knows. The same applies to impact: define what High impact means in concrete schedule days and cost dollars for this project specifically. For a $368,000 relocation project, High impact might mean a delay of more than two weeks or a cost increase above $25,000. For a $10 million infrastructure program, those figures are Low impact. The definitions must match the project's actual stakes, not an abstract standard.
The RtR Scoring Scale
When Thesis Yu set up the RtR risk register, the team agreed on the following before entering a single risk: probability runs five levels from Rare (score 1) to Highly Probable (score 5), and impact runs five levels from Very Low (score 1) to Very High (score 5). The team also agreed what each level meant for the relocation: a Probable risk was one with a pattern of occurrence on similar office relocations and no strong countervailing factor. A High impact was a risk that, if it materialized, would require renegotiating the sponsor's budget or moving the project completion date by more than two weeks. That shared definition meant that when Laize Fair rated a risk as Probable and High, every other team member knew exactly what those words covered. The register's scores could be compared because they were built on the same foundation.
| Score | Probability Level | Impact Level | Cost Impact (RtR) | Schedule Impact (RtR) |
|---|---|---|---|---|
| 1 | Rare | Very Low | Under $2,500 | Under 2 days |
| 2 | Unlikely | Low | $2,500 to $10,000 | 2 to 5 days |
| 3 | Possible | Medium | $10,000 to $25,000 | 1 to 2 weeks |
| 4 | Probable | High | $25,000 to $50,000 | 2 to 4 weeks |
| 5 | Highly Probable | Very High | Over $50,000 | Threatens target date |
Scoring Threats and Opportunities Together
Both threats and opportunities go through qualitative analysis using the same matrix. For opportunities, impact means the size of the potential benefit, not the size of any harm. A threat with Probable probability and High impact scores 16 and demands a substantive response. An opportunity with Probable probability and Medium impact scores 12 and deserves the same planning attention. The scores land in the same register, sorted in the same list. Teams that only analyze threats are leaving half the work undone: they document a negative outcome that the team manages carefully while walking past an upside that a planned response could actively capture. The discipline of running both through the matrix is what closes that gap.
Urgency, Connectivity, and Detectability
Probability times impact captures the core priority signal, but three additional dimensions can shift a risk's place in the work queue when scores alone do not fully separate them.
Urgency asks whether a response needs to happen now or whether there is time. A risk scored 9 that requires a response decision within ten days ranks above a risk scored 12 whose trigger window is three months out. The higher-scored risk matters more in the long run, but the urgent one needs to move to the top of today's agenda. When two risks score similarly, urgency is often the deciding factor.
Connectivity is about cascade potential. A risk that, if it materializes, would activate three other risks carries a combined exposure its individual score does not reflect. In the RtR project, service continuity during relocation was exactly that kind of risk: if the 24/7 emergency operations centre went offline even briefly, it could trigger client contract breaches, which could trigger financial penalties, which could trigger a budget review affecting the relocation timeline itself. That chain made Risk 2 the highest-priority entry regardless of whether another risk technically scored higher.
Detectability asks whether the team will know in time to act. A risk with a clear early-warning signal, like a vendor who reports weekly on installation progress, gives the project manager time to respond when the signal turns negative. A risk with no observable trigger can materialize without warning. Low detectability raises the effective priority of a risk, because the team may not have the response window it assumes. When detectability is low, the response plan needs to be ready in advance rather than built after the warning appears.
Tiered Response by Score Band
Once risks are scored and sorted, the register naturally divides into three response tiers. The dividing lines depend on the project's scale and the scoring model used, but the logic is consistent across projects.
The top tier contains the risks that demand active response plans. These are the risks that, if they materialize without a prepared response, could materially affect the project's objectives. On a five-by-five matrix, this typically means scores from 12 upward, though the threshold should be set explicitly in the risk management plan, not assumed.
Risks in the middle tier call for a defined trigger condition, a named owner, and a review cadence. Sometimes a light response action is also warranted if the cost is low or the response lead time is long. The team agrees on the early-warning indicator: if it appears, they escalate and respond. If it does not appear by the agreed date, the risk can be closed or downgraded.
The lower tier is monitored but not actively managed. These risks are documented, owned, reviewed at scheduled intervals, and closed when they pass out of range. Spending response planning effort on a risk scored 2 is rarely the best use of planning time, but removing it from the register entirely means losing the record of what was considered and why it was accepted.
The RtR Qualitative Scores at a Glance
The table below shows the first three risks from the RtR register after qualitative scoring was applied. The scores drove the response priority directly: Risk 2 moved immediately into active response planning, Risk 1 entered monitoring with a tracking plan for the engineering contract, and Risk 3 landed in the lower tier and was later closed.
| ID | Risk Summary | Type | Impact | Probability | Score | Tier | Status |
|---|---|---|---|---|---|---|---|
| R-01 | Engineering firm relationship enables build-to-suit negotiations on less desirable properties | Opportunity | Medium (3) | Possible (3) | 9 | Middle | Monitoring |
| R-02 | 24/7 emergency services continuity at risk during relocation window; commercial client exposure | Threat | High (4) | Probable (4) | 16 | Top | Awaiting implementation |
| R-03 | Workplace health, safety, or occupancy regulations expected within four months may require design rework | Threat | Low (2) | Possible (3) | 6 | Lower | Closed — withdrawn |
Risk 2's score of 16 placed it in the top tier and made it the lead item on every status meeting agenda until the response strategy was confirmed. That is the register working as a management tool, not as a filing system.
When Qualitative Analysis Is Enough
For most projects, qualitative analysis is sufficient. It produces a prioritized register, drives response planning toward the risks that matter most, and gives the project manager enough information to manage uncertainty effectively. The investment is manageable: a calibration session, a structured identification pass, scoring across the register, and a scheduled review cadence. The outputs, a sorted register with tiered priorities and named owners, support every subsequent risk management decision through execution.
Qualitative analysis falls short in two situations. The first is when a risk's impact is so large and uncertain that the scoring system cannot communicate the real exposure: "High" on a five-point scale covers a wide range, and a project with a potential single risk that could double its cost needs more precision than a score can provide. The second is when executives or external stakeholders require quantified confidence levels before committing significant resources. Saying "this project has a 70% probability of completing within budget" requires quantitative analysis. Saying "this risk is our highest-scored threat" does not.
Decision Tree Analysis — Structure and Expected Value
A decision tree maps a choice and its possible outcomes as a branching diagram. At each branch, the probability of each outcome is assigned and the cost or benefit is estimated. Multiplying probability by impact produces the expected monetary value of that branch. Summing across branches gives the expected value of each decision path. The decision tree does not predict what will happen. It produces an expected value that represents the average outcome if the same situation were played out many times under the same conditions.
For the RtR security installation, the project carried a risk that the vendor would encounter restricted building access during installation, pushing the work past its planned window and creating a conflict with the physical move. The decision tree below models two response options and their expected costs.
Option A: Negotiate a formal building access protocol with the property manager (estimated coordination cost: $1,500 in project staff time)
| Outcome | Probability | Cost Impact | EMV |
|---|---|---|---|
| Access delays still occur, but limited to 2 days with protocol in place | 20% | $3,000 (minor rescheduling) | $600 |
| No access delays — protocol proves unnecessary | 80% | $0 | $0 |
| Expected residual cost from access risk | $600 | ||
| Total expected cost (coordination + expected residual) | $2,100 | ||
Option B: Proceed without a formal protocol (no coordination cost)
| Outcome | Probability | Cost Impact | EMV |
|---|---|---|---|
| Access delays occur, push extends into move window — overtime, rescheduling, subcontractor standby | 60% | $18,000 | $10,800 |
| No access delays | 40% | $0 | $0 |
| Expected cost from access risk | $10,800 | ||
| Total expected cost | $10,800 | ||
Option A has a total expected cost of $2,100. Option B has a total expected cost of $10,800. Spending $1,500 on coordination to negotiate access rights reduces the expected risk cost by more than $8,700. The analysis does not guarantee that delays will occur without a protocol, or that they will not occur with one. It shows that, across the range of likely outcomes, the protocol is worth the investment by a substantial margin. Expected value supports the decision; it does not replace risk appetite. If one branch contains an operationally or reputationally unacceptable outcome, the team may reject it even when the average cost looks tolerable.

Click image to enlarge.
RtR Decision Tree Analysis
Monte Carlo Simulation — Probability Across the Whole Project
A decision tree analyzes a single decision with a defined set of outcomes. Monte Carlo simulation models the entire project at once. Every uncertain variable, task durations, cost estimates, risk event probabilities, gets a probability distribution assigned to it. The simulation runs the project model thousands of times, drawing different values from those distributions each time. Across thousands of runs, a distribution of possible project outcomes emerges: a range of completion dates, a range of final costs, with a quantified probability at each point.
The output answers questions that qualitative analysis cannot: what is the probability of finishing within the approved budget? What completion date can the project team commit to with 90% confidence rather than 50%? The 70th percentile date (P70) is the date by which 70% of the simulation runs completed. The 90th percentile (P90) is the date by which 90% completed. The sponsor's risk appetite determines which confidence level to plan to. A conservative sponsor who cannot absorb a late delivery may plan to P90. A sponsor comfortable with moderate uncertainty may plan to P70 and allocate contingency for the remaining probability. Monte Carlo does not eliminate uncertainty. It makes the shape of that uncertainty visible, so decisions about how much contingency to hold are based on the distribution of outcomes rather than a single best-guess estimate. Use it when many uncertain durations or costs interact and the sponsor needs confidence levels, not just a ranked list of individual risks. As a simple example: instead of saying cabling will take 10 days, the model takes a distribution: 8 days optimistic, 12 days most likely, 18 days pessimistic, drawing from that range each time it runs.
Sensitivity Analysis and the Tornado Chart
A risk register with twenty entries raises a question the qualitative score does not always answer clearly: which of these risks, if it materializes, would do the most damage to the project's outcome? Sensitivity analysis answers that question by varying one risk or uncertain input across its plausible range and measuring how much the project outcome shifts. The result is typically displayed as a tornado chart: a horizontal bar chart where each risk appears as a bar, and the length of the bar represents the potential swing in the project's outcome if that risk materializes versus if it does not. The longest bars appear at the top, narrowing to shorter bars below, which produces the tornado shape.
The value of this view is that it can reveal mismatches between a risk's qualitative score and its actual leverage on project outcomes. A risk with moderate probability but an extreme impact range might have a short bar on the score-sorted list but a very long bar on the tornado chart. That mismatch is a signal: the score-based prioritization might be underweighting that risk's potential damage. Sensitivity analysis does not replace the probability-impact matrix. It adds a dimension the matrix cannot capture: the width of the uncertainty band, not just the most likely cost or schedule effect.
Sizing the Contingency Reserve from the Register
Qualitative analysis prioritizes risks. Quantitative analysis sizes the financial reserve needed to respond to them. The connection between the risk register and the contingency reserve runs through expected monetary value: for each identified threat, multiply its probability by its estimated cost impact to get that risk's contribution to the reserve. Summing across all threats in the register gives a starting figure. Opportunities can be shown separately as potential upside, but only offset them against threat exposure when your organization explicitly accepts that treatment and the benefit is realistically available as project cash in the same window the threat could hit.
| Risk | Type | Probability | Cost Impact | EMV |
|---|---|---|---|---|
| Vendor access delay during security installation | Threat | 60% | $18,000 | +$10,800 |
| Moving company damage or loss during transit | Threat | 25% | $12,000 | +$3,000 |
| IT infrastructure setup requires additional specialist — unplanned labor | Threat | 40% | $8,500 | +$3,400 |
| Engineering firm relationship enables cost reduction on property negotiations | Opportunity | 50% | -$15,000 | -$7,500 |
| Workplace health, safety, or occupancy regulations require design rework | Threat | 30% | $6,000 | +$1,800 |
| Remaining analyzed threats, summarized from register | +$14,000 | |||
| Contingency Reserve (sum of EMVs) | $25,500 | |||
The $25,500 contingency reserve is the project manager's to manage, within the thresholds set in the cost management plan. Drawing on it requires a registered risk to have materialized, documentation of the draw, and an update to the remaining balance. It is not a general buffer. It is money allocated to specific, analyzed risks, sized by the expected monetary value of the threats on the register. The management reserve, held above the cost baseline by executive authority, covers what the analysis could not foresee: events so unexpected they were never logged as risks at all. The two reserves serve different purposes and are subject to different approval levels. That distinction was covered in detail in the cost baseline chapter and does not change based on how the risk analysis was conducted.
One important caution: EMV works well across a large portfolio of risks where high and low outcomes tend to average out. For a single high-impact risk, the expected value can be far lower than the amount actually needed if that risk occurs. A 10% chance of a $100,000 loss produces a $10,000 EMV, but $10,000 will not solve the problem if the loss materializes. For low-probability, high-consequence threats, the EMV is a floor, not a ceiling. Size the reserve with that in mind.
When the RtR team completed their first qualitative scoring pass, the risk register sorted itself. Risk 2, the 24/7 emergency services continuity threat, came out at 16 out of 25. Risk 1, the engineering firm opportunity, came out at 9. Risk 3, the regulatory risk, came out at 6 and was later closed when the regulations were withdrawn.
The effect on the team's meetings was immediate. The register's top entry was a threat with High impact and Probable occurrence, marked "awaiting strategy implementation" with Laize Fair as the named owner. At every status meeting from that point forward, the first agenda item was the status of the offsite emergency services strategy. Not because the project manager put it there. Because a sorted register with a Risk Level 16 at the top made the priority impossible to avoid. That is the difference between a risk register and a list of concerns: one drives decisions, the other documents them.
What's Next
Analysis identifies which risks matter most and how much each is worth in expected cost terms. The next step is deciding what to do about them. Risk Response Planning covers the five strategies for threats and the five for opportunities, how to choose between them, how to write a response that actually reduces the risk rather than just documenting concern, and how to close the response loop with residual risk tracking and contingency plans.
Reflect
- Think of a project where risks were tracked on a list but never scored. How did the team decide which ones to focus on? What would a scored and sorted register have changed about those decisions?
- What does "High impact" mean on the largest project you have worked on, in concrete schedule days or dollar amounts? Was that definition shared explicitly with the team, or was everyone working from their own assumptions?
- Identify a risk from a project you know that had low probability but an extreme potential impact — the kind of risk that would have appeared short on a score-sorted list but long on a tornado chart. How was it managed, and was that management proportionate to the actual exposure?
- When was the last time your team factored opportunities into the risk register alongside threats? What upsides might have been documented and actively pursued if the same analysis discipline had been applied in both directions?
- If you had to size a contingency reserve for a current project using the EMV approach, which risks would you include, and how would you handle the ones where the monetary impact is genuinely difficult to quantify?
Advanced Lean Six Sigma — Data-Driven Excellence
Solve complex problems, reduce variation, and improve performance with confidence. This course is designed for professionals who already know the basics and want to apply advanced Lean Six Sigma tools to real business challenges.
This is not abstract statistics or theory-heavy training. You’ll use Excel to perform real analysis, interpret results correctly, and apply tools like DMAIC, SIPOC, MSA, hypothesis testing, and regression without memorizing formulas or relying on expensive software.
You’ll learn how to measure baseline performance, analyze process capability, use control charts to maintain stability, and validate improvements using statistical evidence. Templates, worked examples, and structured walkthroughs help you apply each concept immediately.
Learn through a complete, real-world Lean Six Sigma project and develop the skills to lead data-driven improvements with credibility. If you’re ready to move beyond basics and make decisions backed by data, enroll now and take your Lean Six Sigma expertise to the next level.

Become an AI-First Agile Leader!
HK School of Management empowers you to master AI as your most powerful co-pilot—without the complexity. Transform your agile leadership with practical, prompt-based workflows and proven strategies designed for real-world scrum challenges. For the price of lunch, you get the tools to automate mundane tasks, refine backlogs with precision, and drive unprecedented efficiency in your team. Backed by our 30-day money-back guarantee—zero risk, real impact.
Learn More