Earned Value Management — Reading Project Performance
The Question the Budget Report Cannot Answer
At the halfway point of a twelve-month construction project, you have spent $600,000 of your $1,200,000 budget. Exactly half the money, exactly halfway through the timeline. Is the project on track? The budget report says yes. But the budget report is asking the wrong question. It is telling you what you spent. It cannot tell you what you got for it. If the work completed so far is worth only $540,000 in planned budget terms, you have spent $600,000 to accomplish $540,000 of value. That is not a project on track. That is a project spending faster than it is progressing, and the gap will compound for the next six months unless something changes. Earned Value Management is the framework that catches this. It connects spending to accomplishment, and it turns a reassuring budget report into an honest picture of where the project actually stands.
Why Straight-Line Thinking Fails
The instinct behind most budget tracking is to divide the total budget evenly across the project timeline and check whether actual spending follows that line. The problem is that project costs are never evenly distributed. Materials arrive in shipments. A specialized contractor works intensively for three weeks and then leaves the project. The beginning of a project has lower direct costs because the work is mostly planning, procurement, and mobilization. The middle phase is where the bulk of spending concentrates. Toward close, activity winds down and final costs taper. Comparing actual spending against a flat budget line creates misleading signals throughout: you appear to be under budget early (because spending hasn't ramped up yet), roughly on track in the middle, and potentially over budget late even if the project is performing well. The line is the wrong reference.
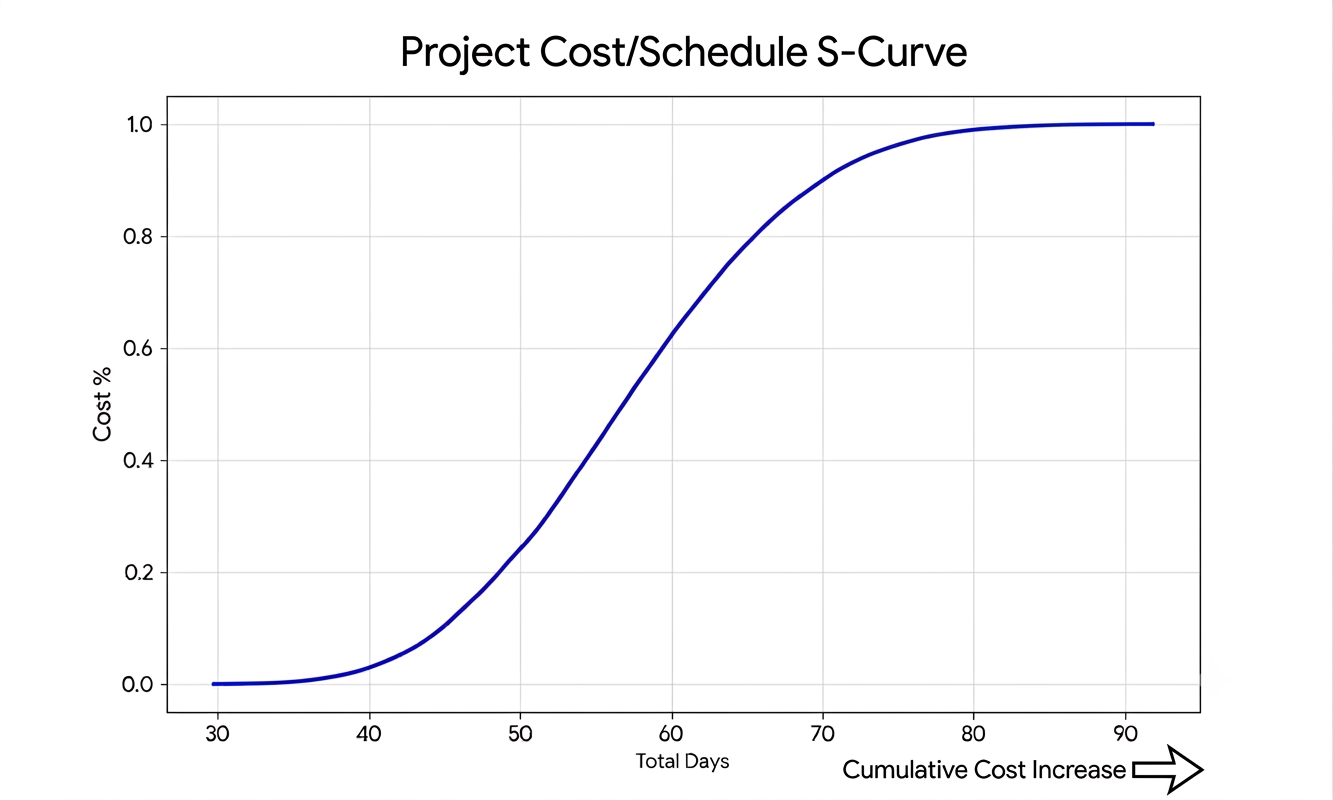
When you chart planned expenditure against time on a properly planned project, the result is an S-curve. Spending starts slowly, accelerates through execution, and tapers at close. This is the shape that reflects reality. The S-curve is the visual form of Planned Value over time: PV at any point on the curve equals the budgeted cost of all work scheduled to be complete by that date. Any meaningful cost comparison needs to account for where the project is on that curve, not just what percentage of the calendar has elapsed. Earned Value Management is built around this time-phased approach. Its reference point is not a flat line; it is the approved project plan, which reflects when money was actually expected to be spent.
The Three Core Values
Every EVM calculation begins with three numbers. Planned Value is the budget for the work that was scheduled to be completed by this point in time. It comes directly from the approved project plan and answers the question: how much value were we supposed to have generated by now? Earned Value is the budget for the work that has actually been completed. It does not measure how much you spent. It measures what you accomplished, expressed in the same dollar terms as the original plan. Actual Cost is the real money spent to date — every payment made, every invoice approved, every cost committed and accrued through the measurement date.
The word "earned" carries specific meaning that takes a moment to fully absorb. In everyday language, "earned" connects to effort. In EVM, it connects to completion. You earn value when work is finished, not when hours are logged, not when money goes out the door, and not when time passes. If a deliverable was budgeted at $30,000 and you complete it, you earn $30,000 of value regardless of whether it cost you $25,000 or $38,000 to complete. This is the insight that makes EVM powerful. It separates "how much did we spend?" from "how much did we accomplish?" — two questions that have completely different answers on most projects, and that traditional budget reports systematically conflate.
Measuring Earned Value: How to Know What Is Actually Done
The central challenge in EVM is determining what percentage of a work package is genuinely complete. Self-reported progress is unreliable. The notorious "90% done" problem is real: tasks that are reported at 90% complete for weeks because the remaining 10% is harder than expected. Several methods exist for measuring EV more objectively:
- Binary milestones (0/100). The work package is either complete or it isn't. No partial credit. Works well for short-duration work packages of one or two weeks.
- 50/50 rule. Half credit when work begins, full credit when it completes. Simple and consistent. Works well for medium-duration packages when 0/100 is too coarse.
- Weighted milestones. Define key checkpoints within the work package, assign a percentage to each, and earn that percentage when each checkpoint is reached.
- Objective percent complete. Only applicable when completion is physically measurable: meters of pipe laid, pages of documentation reviewed, test cases executed.
Avoid relying on subjective team estimates alone. A team member who says "I'd say about 60% done" is offering a guess, not a measurement. Choose a method in advance, apply it consistently, and treat the resulting EV number as a controlled output rather than a survey of feelings about progress.
The Four Core Metrics
| Metric | Formula | What It Measures | Positive / Above 1.0 | Negative / Below 1.0 |
|---|---|---|---|---|
| Cost Variance (CV) | EV − AC | Dollar gap between value earned and money spent | Under budget: earning more value than you're spending | Over budget: spending more than the accomplished work is worth |
| Schedule Variance (SV) | EV − PV | Dollar gap between work accomplished and work planned | Ahead: completed more than the plan required by this date | Behind: completed less than the plan required by this date |
| Cost Performance Index (CPI) | EV ÷ AC | Dollars of value earned per dollar spent | Above 1.0: getting more than $1 of value per $1 spent | Below 1.0: getting less than $1 of value per $1 spent — cost overrun rate |
| Schedule Performance Index (SPI) | EV ÷ PV | Rate of progress against plan | Above 1.0: completing work faster than planned | Below 1.0: completing work slower than planned |
Two important points about how to read these metrics. First, Schedule Variance is measured in dollars, not days. A negative SV of $110,000 means the project has accomplished $110,000 less work than planned by this date — it is not directly translating to a number of days late. For a time-in-days picture, you need to look at the schedule baseline directly. Second, the performance indices (CPI and SPI) are the most useful numbers for forecasting, because they express efficiency as a rate. A CPI of 0.90 means for every dollar spent, the project is generating ninety cents of earned value. That rate, extended forward, projects where the project will finish financially.
Reading the Combination
In practice, you always read CPI and SPI together. Each combination tells a distinct story and points toward a different type of response.
| CPI | SPI | What It Means | Where to Focus |
|---|---|---|---|
| Above 1.0 | Above 1.0 | Under budget and ahead of schedule — the project is performing well on both dimensions | Check whether the pace is sustainable and whether quality is holding; verify that the schedule lead isn't creating rework risk |
| Below 1.0 | Above 1.0 | Over budget but ahead of schedule — spending too much but moving fast | Investigate what is driving the cost overrun; the schedule lead may disappear if the cost issue is addressed by reducing resources |
| Above 1.0 | Below 1.0 | Under budget but behind schedule — efficient with money but not producing fast enough | Look for resource gaps, dependency delays, or scope clarity issues slowing progress; consider whether crashing is feasible |
| Below 1.0 | Below 1.0 | Over budget and behind schedule — the most challenging scenario; both dimensions are moving in the wrong direction | Requires sponsor conversation about recovery options: scope reduction, additional resources, revised completion date, or a combination |
A Complete Worked Example
The Riverside Community Center is a $1,200,000 construction project planned to complete in twelve months. The project entered monitoring at month six. Three numbers arrive from the project controller:
- Planned Value (PV): $650,000 — the planned budget for work scheduled to be complete by month six
- Earned Value (EV): $540,000 — the budget value of work actually completed
- Actual Cost (AC): $600,000 — the real money spent to date
Step through the calculations:
| Metric | Formula | Calculation | Result | Interpretation |
|---|---|---|---|---|
| Cost Variance | EV − AC | $540,000 − $600,000 | −$60,000 | Spending $60,000 more than the completed work is worth |
| Schedule Variance | EV − PV | $540,000 − $650,000 | −$110,000 | $110,000 worth of planned work has not been completed yet |
| CPI | EV ÷ AC | $540,000 ÷ $600,000 | 0.90 | Getting 90 cents of value for every dollar spent |
| SPI | EV ÷ PV | $540,000 ÷ $650,000 | 0.83 | Completing work at 83% of the planned rate — significantly behind |
Both indices are below 1.0, which means the project has cost and schedule problems simultaneously. The CPI of 0.90 says the project is overspending relative to progress at a 10% rate. The SPI of 0.83 is the more immediate concern: the project is only completing 83% of what the plan calls for each period. At that rate, a twelve-month project will not finish in twelve months. These numbers together point toward a specific conversation with the sponsor, not a vague acknowledgment that "things are a bit behind." The next chapter extends this example to calculate where the project is projected to finish and what it would take to recover.
At the end of week eight on a sixteen-week, $200,000 software implementation, the monthly budget report arrived. The project had spent $96,000 against a planned spend of $100,000 — four thousand under. The sponsor messaged before lunch: "Good news on the budget front. Nice work keeping it tight."
The PM opened the EVM tracking sheet maintained alongside the standard reports. Planned Value at week eight: $100,000. Earned Value: $78,000. Actual Cost: $96,000. Cost Variance: −$18,000. CPI: 0.81. For every dollar spent, the project had earned 81 cents of value. The budget report showed four thousand under. The EVM snapshot showed a project on a trajectory to finish forty-seven thousand over.
The PM prepared a single page. Top: the budget report numbers. Below: the EVM snapshot with two sentences. "The budget report reflects what we've spent. The EVM snapshot reflects what we've accomplished for that spend. Current trajectory puts us $47,000 over at completion." (How the $47,000 forecast figure is calculated is covered in the next chapter on EVM forecasting.) A request for twenty minutes followed. The sponsor called thirty minutes after receiving it. She had not known the two numbers could diverge that way. The conversation about recovery options — scope, pace, expectations — was only possible because it happened in week eight. In week fourteen, it would have been a post-mortem.
When EVM Is Worth Implementing
EVM at its full depth — with formally maintained performance measurement baselines, monthly index calculations, and multi-work-package tracking — is calibrated to large or complex projects where the cost of not knowing the performance picture outweighs the overhead of maintaining it. Government programs, major infrastructure projects, and complex multi-phase technology implementations are natural candidates. On a small internal project with three team members and a ten-week timeline, full EVM may produce more overhead than insight.
The concepts, however, apply at any scale. The question of whether spending reflects accomplishment is relevant on every project. Even a simplified version gives meaningfully more information than a budget report alone. A minimum viable EVM setup needs only four things:
- A planned schedule with work packages that have assigned budget values.
- A consistent method for measuring completion (binary, 50/50, or weighted milestones).
- Actual cost tracked to the work package level.
- A weekly calculation of CV, SV, CPI, and SPI — even in a simple spreadsheet.
That is the foundation. Start there, and the question asked at every weekly review shifts from "are we within budget?" to "is what we're accomplishing worth what we're spending?" That is a fundamentally better question.
What's Next
The next chapter, EVM Forecasting, extends the Riverside Community Center example to calculate where the project is projected to finish — and introduces the forecasting metrics that tell you not just where you are, but how hard the remaining work will need to go to meet the original budget or the revised one.
Reflect
- On the Riverside Community Center at month six: CPI is 0.90 and SPI is 0.83. Which problem concerns you more, the cost overrun or the schedule underperformance? Why? What would you investigate first?
- Think of a recent project where the budget report showed spending was in range. Would the EVM picture have told the same story? What data would you have needed to calculate EV?
- When a team member says a task is "90% complete," what does that actually mean in EVM terms? What would you need to know to treat that assessment as a reliable EV measurement?
- Have you ever been surprised by a project's final cost after receiving reassuring budget reports throughout execution? What was the gap between what spending suggested and what performance was actually delivering?
Agile Project Management & Scrum — With AI
Ship value sooner, cut busywork, and lead with confidence. Whether you’re new to Agile or scaling multiple teams, this course gives you a practical system to plan smarter, execute faster, and keep stakeholders aligned.
This isn’t theory—it’s a hands-on playbook for modern delivery. You’ll master Scrum roles, events, and artifacts; turn vision into a living roadmap; and use AI to refine backlogs, write clear user stories and acceptance criteria, forecast with velocity, and automate status updates and reports.
You’ll learn estimation, capacity and release planning, quality and risk management (including risk burndown), and Agile-friendly EVM—plus how to scale with Scrum of Scrums, LeSS, SAFe, and more. Downloadable templates and ready-to-use GPT prompts help you apply everything immediately.
Learn proven patterns from real projects and adopt workflows that reduce meetings, improve visibility, and boost throughput. Ready to level up your delivery and lead in the AI era? Enroll now and start building smarter sprints.

Lead with clarity, influence, and outcomes.
HK School of Management brings you a practical, no-fluff Leadership for Project Managers course—built for real projects, tight deadlines, and cross-functional teams. Learn to set direction, align stakeholders, and drive commitment without relying on title. For the price of a lunch, get proven playbooks, and downloadable templates. Backed by a 30-day money-back guarantee—zero risk, high impact.
Learn More