Have you ever wondered why, in a Monte Carlo simulation, a simple triangle can predict the future? It feels like a magic trick. You give the computer three numbers—Optimistic, Most Likely, and Pessimistic—and it spits out a range of possible dates.
But if you look under the hood, it isn’t magic. It’s geometry. Specifically, it’s about the relationship between area and probability. To truly master project risk, you need to understand how the computer “slices” your triangle to find your deadline.
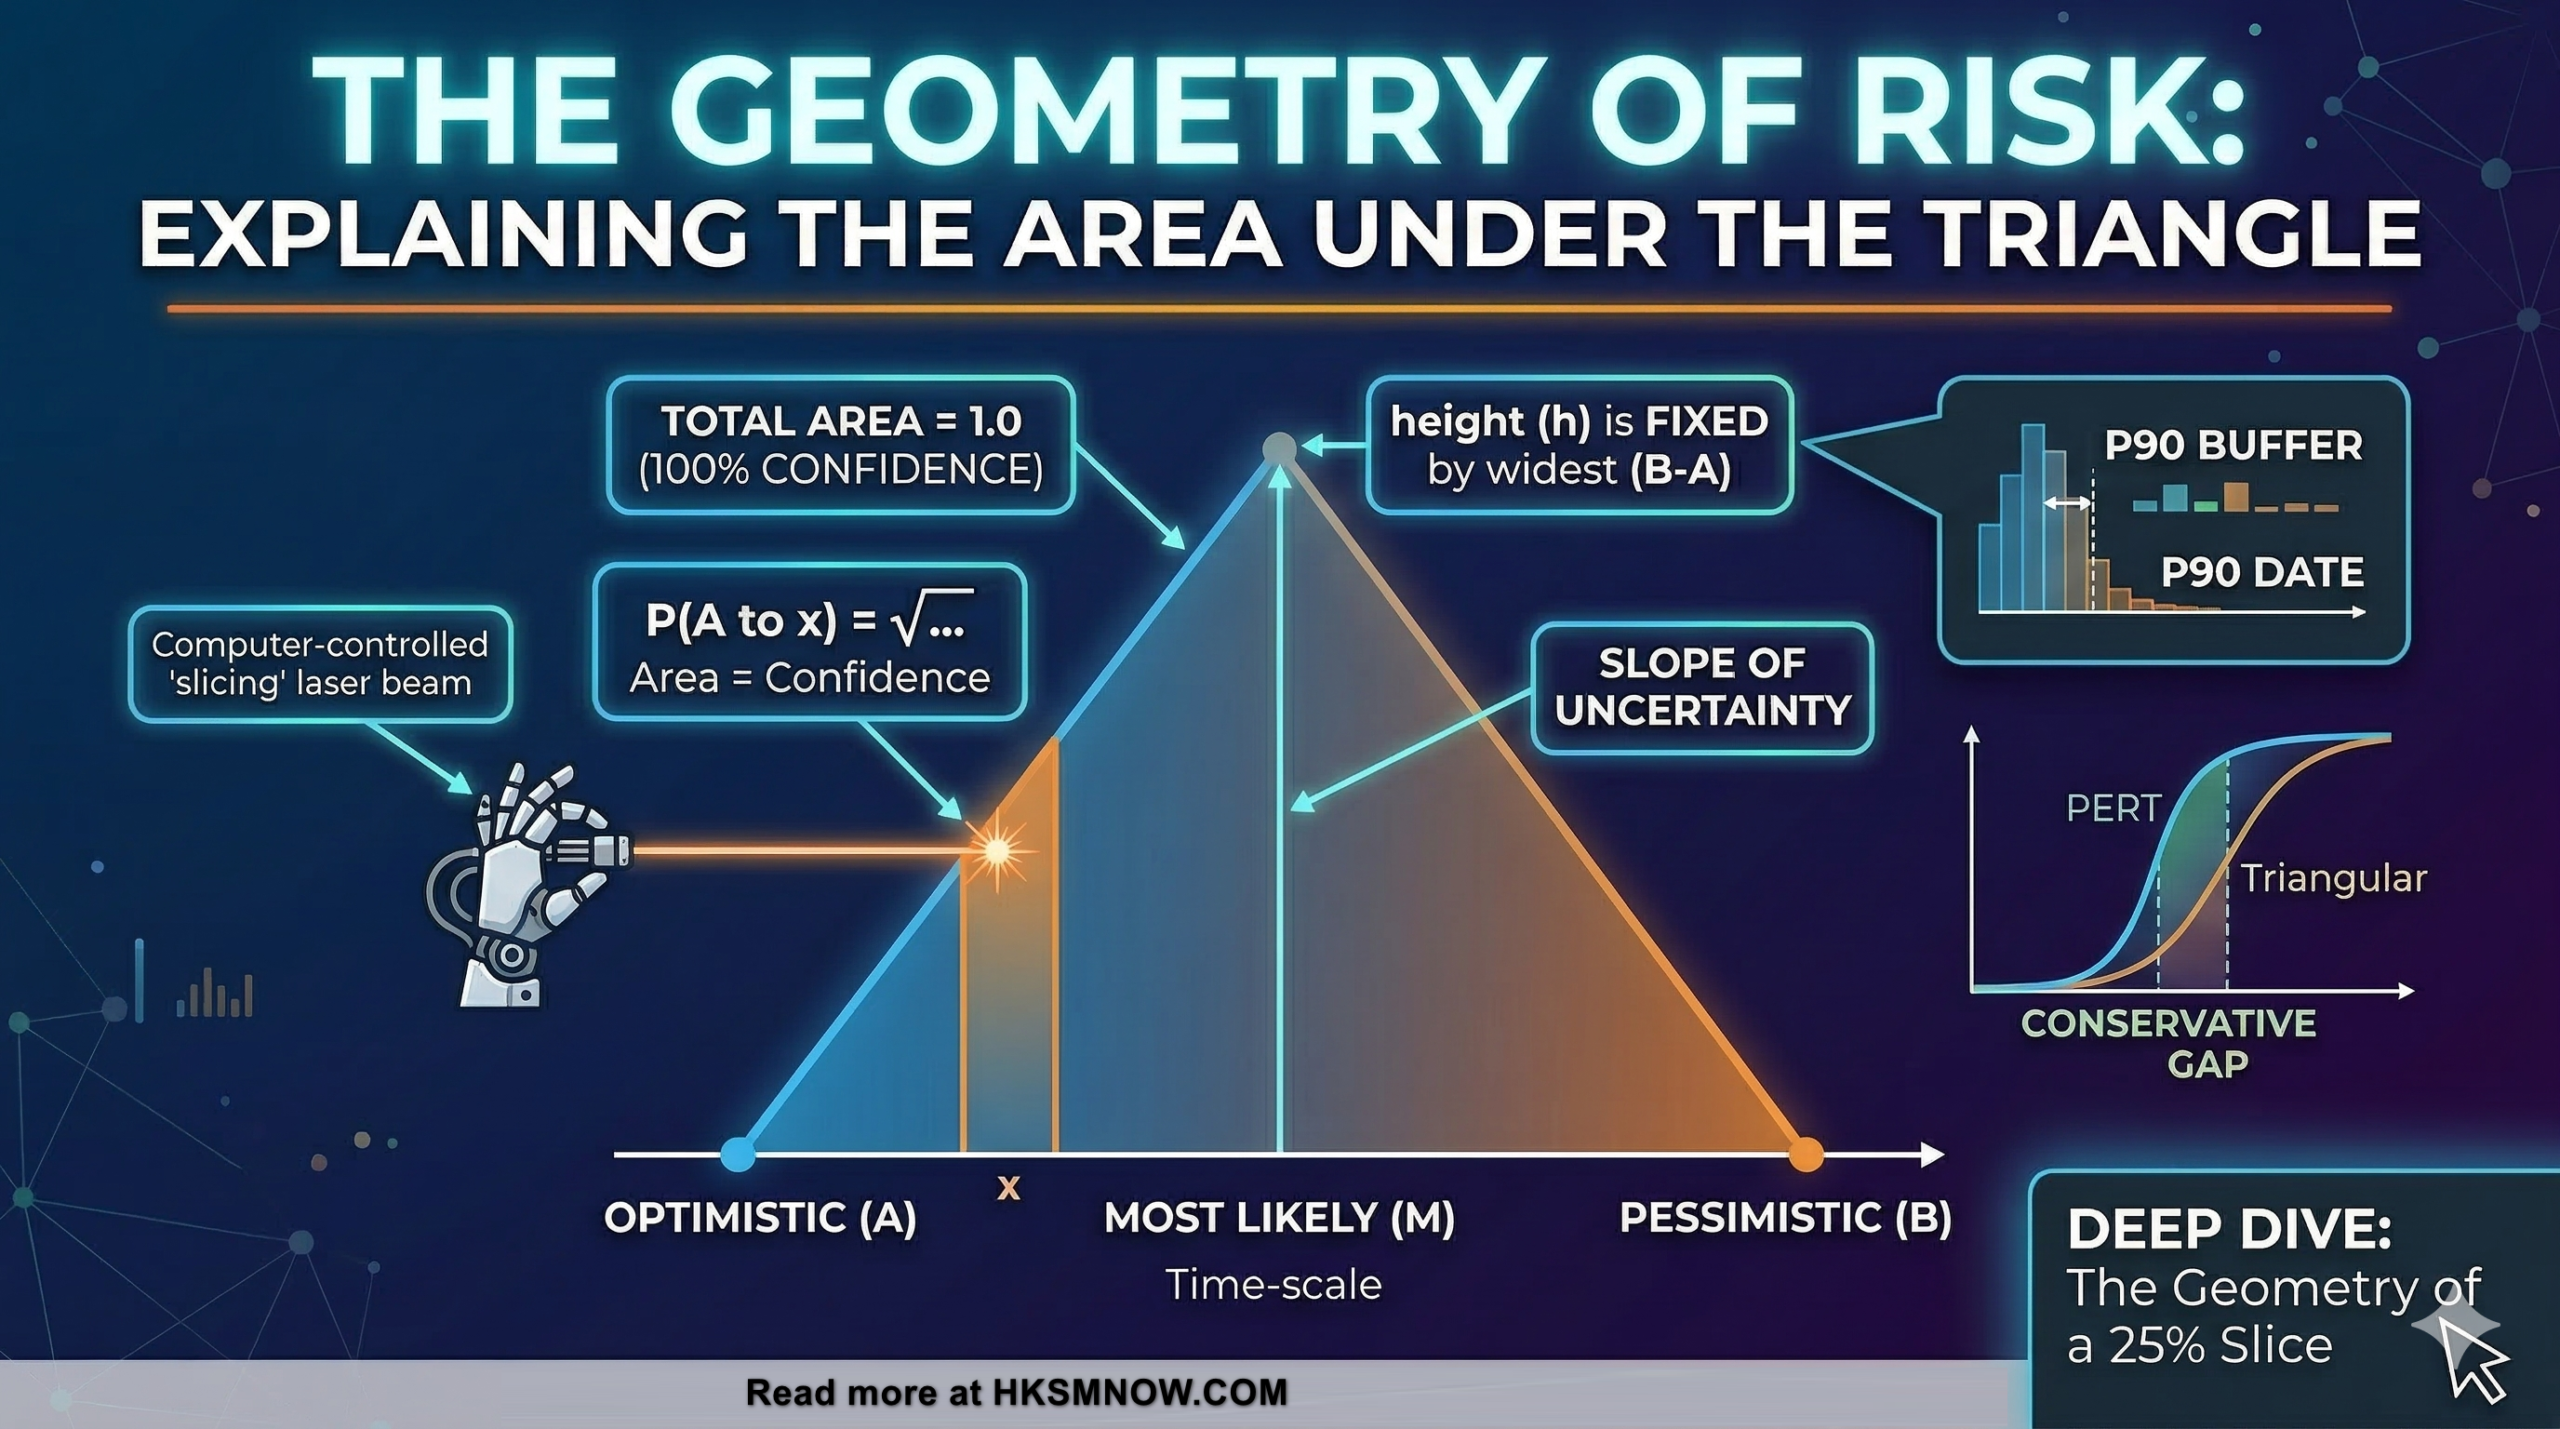
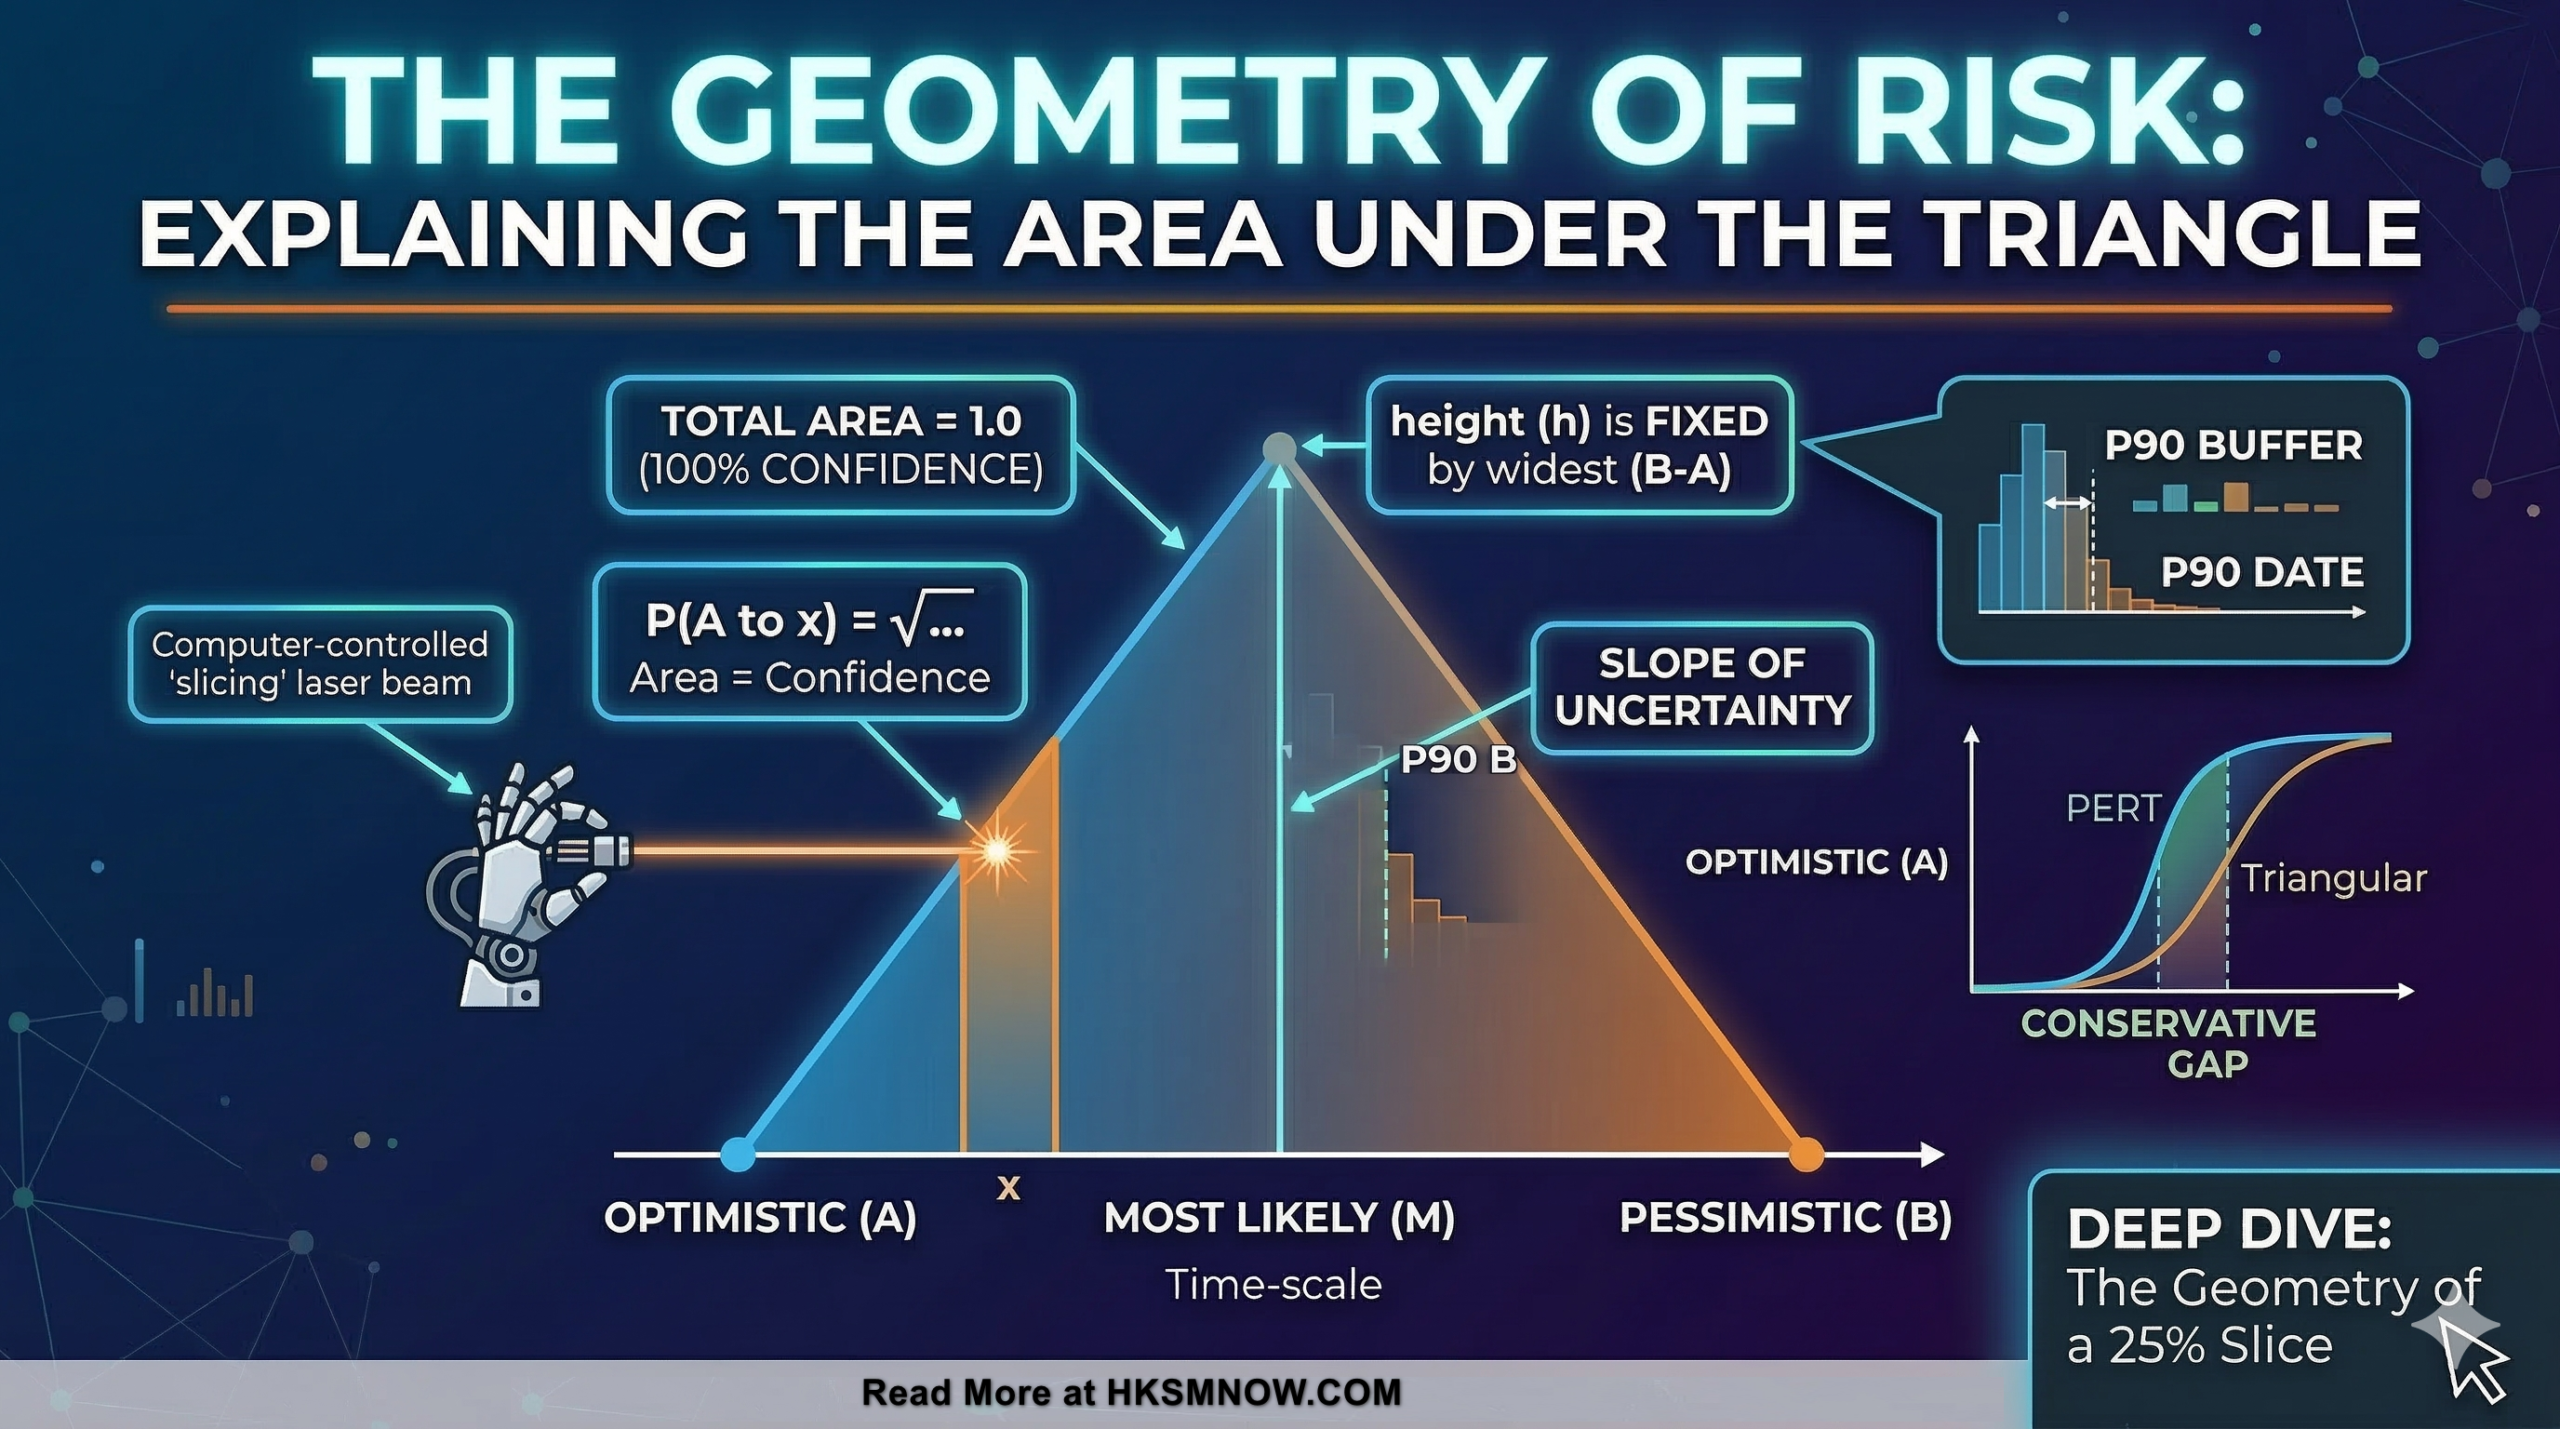
Today, we are going to break down the “Geometry of Risk.” We will explain why the total area must equal 1.0, how the “Most Likely” peak creates the “Slope of Uncertainty,” and why the math requires a square root to get it right.
The Law of the Total Area: Why 1.0 is Everything
In the world of probability, the “Total Area” under any distribution curve represents the sum of all possible outcomes. Since it is 100% certain that something will happen, the total area must always equal 1.0.
Think of your task duration as a literal physical triangle. If you add up every possible sliver of that triangle, from the very first day (Optimistic) to the very last day (Pessimistic), you must account for 100% of the possibilities.
This is a fundamental rule. If your triangle’s area was 0.8, it would mean there is a 20% chance that the task simply… doesn’t exist. By keeping the area at 1.0, the math ensures that every simulated “marble” the computer pulls from the jar lands somewhere within your estimates.
The “Slope of Uncertainty”
When you provide a Most Likely (M) value, you are creating a peak. This peak divides your triangle into two halves:
- The Upward Slope (A to M): This represents the path from “Perfect” to “Realistic.”
- The Downward Slope (M to B): This represents the path from “Realistic” to “Worst-Case.”
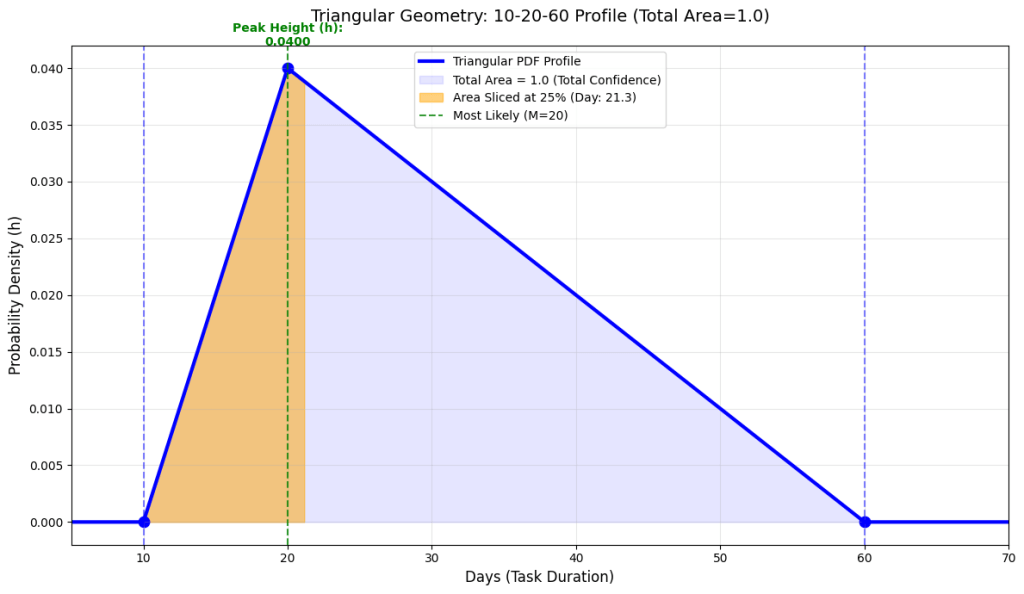
The height of that peak isn’t random. To keep the total area at 1.0, the math calculates the height (h) of your triangle using the formula:
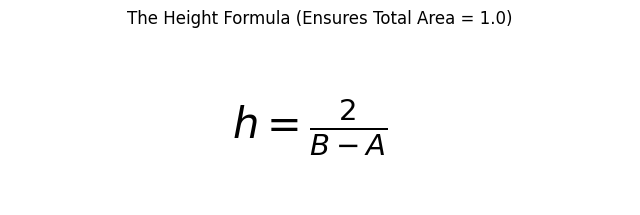
Because the height is fixed by the width of your estimates, a “wider” triangle (more uncertainty) will actually have a “shorter” peak. This is the geometry of risk telling you that the more spread out your possibilities are, the less “certain” (less probable) your Most Likely date becomes.
Why the Square Root? The “Slicing” Secret
This is the part that usually confuses people in the Python code. Why do we see a square root of u in the formula?
\sqrt{u}
Imagine you want to find the day where there is a 25% chance of finishing. In geometry terms, you are looking for a vertical “slice” through the triangle that traps exactly 25% of the total area on the left side.
Because the area of a triangle is calculated by multiplying its base by its height, and the height changes as you move along the slope, the area grows quadratically (like a square). To work backward from an area (the probability $u$) to a distance (the day), we have to use the inverse of a square – the Square Root.
When the computer picks a random number u=0.25, it doesn’t just go 25% of the way across the base. It uses the square root to find the exact point on the slope where the “triangle-within-a-triangle” equals 25% of the total mass.
What This Geometry Means for Your Projects
Understanding the geometry of the triangle changes how you see your estimates:
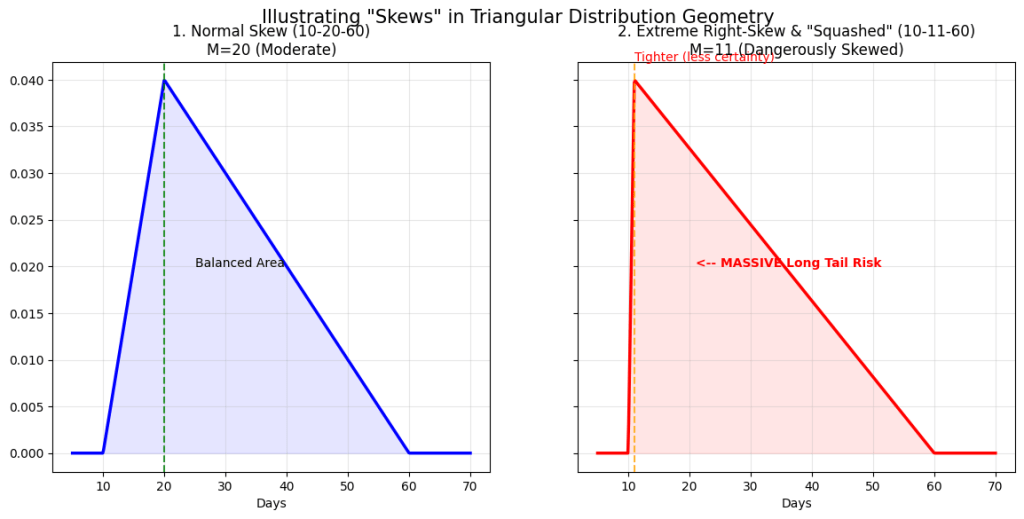
- The Power of the Peak: If your peak (M) is very close to your optimistic (A) side, you have a “Right-Skewed” triangle. This means you have a long, dangerous tail of risk. The geometry tells you that even if you are “usually” fast, the sheer area of that long tail is going to pull your P90 date much further than you expect.
- The “Squashed” Triangle: If your range (B minus A) is huge, your probability density is “squashed” flat. This means no single day is very likely to occur. This is a red flag that you don’t actually have enough information to plan effectively.
- Area = Confidence: When you look at an S-Curve, you are literally looking at the “accumulated area” of the triangle as you move from left to right.
Summary
Geometry is the language of risk. The Triangular distribution works because it translates the messy, human uncertainty of “Optimistic” and “Pessimistic” into a solid, geometric shape that can be measured, sliced, and calculated.
The next time you run a simulation and see that P90 date, remember: you aren’t just looking at a number. You are looking at the point where 90% of the physical area of your risk triangle has been accounted for. It is the solid, geometric proof that you have enough buffer to survive the storm.