
Project managers are often expected to speak two languages at the same time. One language is delivery: scope, schedule, resources, risks, issues, and stakeholders. The other language is business: investment, return, value, cash flow, and decision-making.
That second language can feel uncomfortable if you do not come from a finance background. Yet it matters. Many project decisions are not approved because they sound interesting. They are approved because they make financial sense, reduce costs, increase revenue, improve efficiency, or protect the organization from risk.
That is where formulas like Return on Investment, Payback Period, Net Present Value, and Internal Rate of Return become useful. You do not need to become a financial analyst to use them well. But you do need to understand what they mean, how they are calculated, and what they tell you about a project.
In this article, we will walk through these formulas in plain language. We will look at how they help project managers compare options, justify investments, and communicate better with sponsors and decision-makers.
Why Financial Formulas Matter in Project Management
Every project consumes resources. It may require money, people, equipment, software, training, consulting, or management attention. Even internal projects have a cost because employees spend time working on them instead of doing something else.
When a sponsor asks, “Is this project worth doing?” they are usually asking a financial question.
They may want to know:
- How much will this project cost?
- How much value will it create?
- How quickly will we recover the investment?
- Is this better than another project?
- Does the return justify the risk?
- What happens if the benefits arrive later than expected?
Financial formulas help answer these questions in a structured way.
They also help reduce emotional decision-making. Without financial analysis, projects can be approved because they sound exciting, because a senior person likes the idea, or because everyone assumes the benefits are obvious. That can lead to poor investment choices.
For project managers, these formulas are useful because they connect delivery work to business value. They help you explain not only what the project will produce, but why the organization should care.
Here is the formulas that we will dive deeper in the blog.
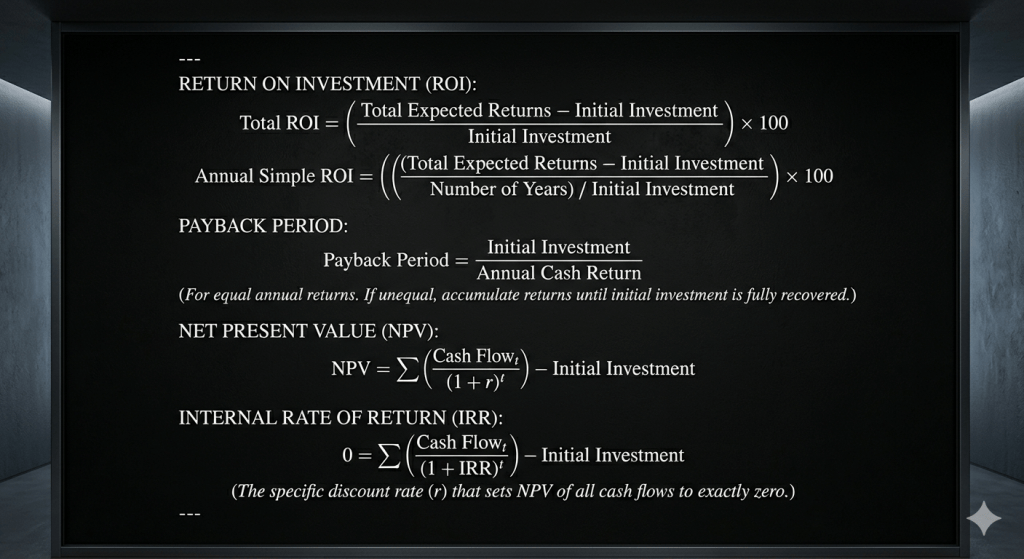
The Basic Idea: Investment, Return, and Cash Flow
Before looking at each formula, let’s clarify a few basic terms.
An initial investment is the amount of money required to start or complete the project. For example, a company may spend $100,000 to implement a new software system.
A cash return or cash benefit is the financial value the project generates. This could come from increased sales, reduced labor costs, avoided maintenance costs, fewer defects, lower energy consumption, or faster processing time.
A cash flow is money moving in or out during a specific period. In project finance examples, Year 0 often shows the initial investment as a negative cash flow. Later years show benefits as positive cash flows.
For example:
- Year 0: -$100,000 initial investment.
- Year 1: +$30,000 benefit.
- Year 2: +$40,000 benefit.
- Year 3: +$50,000 benefit.
This simple structure is the foundation for all the formulas we will discuss.
Return on Investment
Return on Investment, often called ROI, is one of the most common financial measures in project management.
ROI tells you how much return you receive compared to the amount invested. It is usually shown as a percentage.
The basic formula is:
Total ROI = ((Total Benefits - Initial Investment) / Initial Investment) × 100Another way to write it is:
Total ROI = (Net Return / Initial Investment) × 100Where:
Net Return = Total Benefits - Initial InvestmentLet’s use a simple example.
Suppose a project costs $100,000. Over several years, it is expected to generate $150,000 in total benefits.
The net return is:
$150,000 - $100,000 = $50,000The ROI is:
($50,000 / $100,000) × 100 = 50%That means the project returns 50% more than the original investment.
What ROI Means for Project Managers
ROI is useful because it is simple and easy to communicate. If you tell a sponsor that a project has a 50% expected ROI, they can quickly understand that the benefits exceed the cost.
However, ROI does not explain when the benefits happen. That is an important limitation.
A project that returns 50% in one year is very different from a project that returns 50% over ten years. Both may have the same total ROI, but the first project is much more attractive financially.
That is why project managers should be careful when using ROI alone. It is a helpful starting point, but it does not tell the full story.
Annual Simple ROI
Sometimes you want to express the return as an average annual figure. This is where Annual Simple ROI can help.
The formula is:
Annual Simple ROI = (((Total Benefits - Initial Investment) / Number of Years) / Initial Investment) × 100A simpler version is:
Annual Simple ROI = Total ROI / Number of YearsUsing the earlier example, the total ROI is 50%. If the benefits happen over five years, the Annual Simple ROI is:
50% / 5 = 10% per yearThis gives a quick estimate of the average return per year. (This gives a quick, simple estimate of the average return per year. It does not account for the timing of cash flows, compounding, or the time value of money.(compound return is 1.1^5=1.61 or 61% return)
Simple ROI vs. Compound Return
It is important to understand that Annual Simple ROI is not the same as compound annual growth rate. It simply spreads the total return evenly across the number of years.
That may be good enough for early project screening. But it is not a precise measure of year-by-year investment performance.
For project managers, the key point is this: Annual Simple ROI is useful for explaining the average return, but it does not account for the exact timing of cash flows.
If timing matters, Net Present Value and Internal Rate of Return are stronger tools.
Payback Period
Payback Period answers a very practical question:
How long will it take to recover the initial investment?
The basic formula is:
Payback Period = Initial Investment / Annual Cash ReturnThis formula works when annual cash returns are equal.
For example, suppose a project costs $100,000 and generates $25,000 per year in cash benefits.
The payback period is:
$100,000 / $25,000 = 4 yearsThis means the organization recovers its investment after four years.
Why Payback Period Is Useful
Payback Period is popular because it is easy to understand. Sponsors often like it because it focuses on risk and liquidity.
A shorter payback period usually feels safer. If the organization recovers its money quickly, there is less uncertainty about long-term forecasts.
For example, a project with a two-year payback may be easier to approve than a project with a seven-year payback. The longer the time period, the more things can change. Market conditions may shift. Technology may become outdated. Business priorities may move in a different direction.
For project managers, Payback Period can be especially useful when the organization has limited cash or wants quick wins.
The Limitation of Payback Period
Payback Period has one major weakness. It ignores what happens after the investment is recovered.
Imagine two projects:
- Project A pays back in two years and then generates very little additional benefit.
- Project B pays back in three years but creates major benefits for ten more years.
If you only look at Payback Period, Project A may look better. But from a total value perspective, Project B may be much stronger.
So Payback Period is helpful, but it should not be the only decision measure.
Payback Period with Unequal Cash Flows
In real projects, cash flows are often uneven. Benefits may grow slowly at first, then increase later. Or the project may generate larger savings in some years than others.
When annual cash flows are unequal, you calculate the payback period using a cumulative cash flow approach. You track the remaining unrecovered investment year by year until the investment is fully recovered.
If the investment is recovered mid-year, you use a fractional calculation for that final year.
Step-by-Step Process
To calculate payback with unequal cash flows:
- Set up a table with columns for Year, Cash Flow, and Cumulative Cash Flow.
- For Year 0, the cumulative balance is the negative initial investment.
- For each subsequent year, add that year’s cash flow to the running cumulative balance.
- Identify the last full year before recovery, where the cumulative balance is still negative.
- Calculate the fraction of the next year needed to recover the remaining balance.
The fractional year formula is:
Fractional Year = Remaining Investment at Start of Year / Total Cash Flow During YearExample Calculation
Suppose the initial investment is $100,000.
The expected cash flows are:
- Year 1 Cash Flow: $30,000.
- Year 2 Cash Flow: $40,000.
- Year 3 Cash Flow: $50,000.
Now calculate the cumulative balance:
- Year 0: -$100,000.
- Year 1: -$70,000.
- Year 2: -$30,000.
- Year 3: +$20,000.
The investment is still not recovered at the end of Year 2. At that point, $30,000 remains unrecovered.
During Year 3, the project generates $50,000. That is enough to recover the remaining $30,000.
Now calculate the fractional year:
$30,000 / $50,000 = 0.6The total payback period is:
2 + 0.6 = 2.6 yearsThis means the project pays back its investment 60% of the way through Year 3.
What This Means in Real Projects
This approach is more realistic than assuming equal annual benefits. Many business improvements do not produce full benefits immediately.
For example, a new customer relationship management system may have modest benefits in Year 1 because users are still learning it. In Year 2, adoption improves. In Year 3, the sales team may fully integrate it into their process.
Using cumulative cash flow gives a more accurate view of when the investment is truly recovered.
Net Present Value
Net Present Value, or NPV, is one of the most important investment decision tools.
NPV considers the time value of money. This means money today is worth more than the same amount of money in the future.
Why? Because money today can be invested, used, or saved. Future money is also less certain. Inflation, risk, and opportunity cost all matter.
The NPV formula is:
NPV = Σ [Cash Flow_t / (1 + r)^t] - Initial InvestmentWhere:
- Cash Flow_t = Cash return in year t.
- r = Discount rate or cost of capital.
- t = The specific year.
The discount rate represents the required rate of return. It may reflect the organization’s cost of capital, risk level, or minimum acceptable return.
Simple NPV Example
Suppose a project requires an initial investment of $100,000. It is expected to generate $40,000 per year for three years. The discount rate is 10%.
The future cash flows are discounted because they happen later.
Year 1 present value:
$40,000 / (1 + 0.10)^1 = $36,363.64Year 2 present value:
$40,000 / (1 + 0.10)^2 = $33,057.85Year 3 present value:
$40,000 / (1 + 0.10)^3 = $30,052.59Total present value of future cash flows:
$36,363.64 + $33,057.85 + $30,052.59 = $99,474.08Now subtract the initial investment:
$99,474.08 - $100,000 = -$525.92The NPV is negative.
That means the project does not meet the required 10% return based on these assumptions.
How to Interpret NPV
NPV gives a clear decision signal:
- If NPV is positive, the project is expected to create value above the required return.
- If NPV is zero, the project is expected to exactly meet the required return.
- If NPV is negative, the project is expected to fall short of the required return.
For project managers, NPV is powerful because it accounts for timing. It recognizes that receiving $50,000 next year is better than receiving $50,000 five years from now.
This is especially useful for long-term projects, capital investments, technology upgrades, and infrastructure work.
NPV in Day-to-Day Project Decisions
You may not personally calculate NPV for every project. Finance teams often do that. But you should understand what the result means.
If your project has a weak NPV, you may need to revisit the assumptions.
You might ask:
- Can we reduce the initial investment?
- Can we deliver benefits earlier?
- Can we increase annual savings?
- Can we reduce risk?
- Can we phase the project differently?
- Are there non-financial benefits that still justify the work?
This is where project management and financial analysis meet. Your delivery choices can affect the business case.
For example, if you can deliver part of the solution earlier, the organization may start receiving benefits sooner. That can improve NPV.
Internal Rate of Return
Internal Rate of Return, or IRR, is closely related to NPV.
IRR is the discount rate that makes the Net Present Value equal to zero.
The formula is:
0 = Σ [Cash Flow_t / (1 + IRR)^t] - Initial InvestmentIn plain language, IRR tells you the project’s expected rate of return based on its cash flows.
If a project has an IRR of 15%, it means the project is expected to generate a return equivalent to 15%, based on the timing and size of its cash flows.
How IRR Is Usually Calculated
IRR is usually calculated using software. You do not normally solve it by hand.
In Excel, you can use the IRR function. You enter the initial investment as a negative cash flow and future benefits as positive cash flows.
For example:
Year 0: -100,000
Year 1: 30,000
Year 2: 40,000
Year 3: 50,000
Excel can then calculate the IRR for that cash flow pattern.
How to Interpret IRR
IRR is useful because it expresses the return as a percentage. That makes it easy to compare with a required return or cost of capital.
For example, suppose your organization requires a minimum return of 10%.
If the project’s IRR is 14%, the project may be financially attractive.
If the project’s IRR is 7%, the project may not meet the organization’s investment threshold.
Project sponsors often like IRR because percentages are easy to compare. However, IRR can sometimes be misleading.
The Limitation of IRR
IRR can be less reliable when cash flows are unusual.
For example, a project may have negative cash flows later in its life. This can happen when there are major maintenance costs, shutdown costs, cleanup costs, or reinvestment requirements.
In these cases, there can sometimes be multiple IRRs or confusing results.
IRR can also make smaller projects look better than larger projects. A small project may have a high percentage return but create less total value. A larger project may have a lower IRR but generate much more total value.
That is why many organizations prefer NPV as the stronger decision measure.
ROI vs. Payback Period vs. NPV vs. IRR
Each formula answers a different question.
ROI answers:
How much total return do we get compared to the investment?Payback Period answers:
How long does it take to recover the investment?NPV answers:
How much value does the project create today, after considering the time value of money?IRR answers:
What rate of return does the project generate?These formulas are not competitors. They are different lenses.
A good business case may use several of them together.
For example, a project may have:
- A 45% total ROI.
- A 2.6-year payback period.
- A positive NPV of $75,000.
- An IRR of 16%.
Together, these measures tell a more complete story.
The ROI shows the overall return. The payback period shows how quickly the investment is recovered. The NPV shows whether the project creates value after discounting future cash flows. The IRR shows the expected rate of return.
A Simple Project Scenario
Imagine your organization is considering a new automated reporting system.
The current reporting process is manual. Several employees spend hours each week collecting data, cleaning spreadsheets, and preparing reports. The new system would reduce manual effort and improve reporting speed.
The initial investment is $120,000.
Expected annual benefits are:
- Year 1: $35,000.
- Year 2: $45,000.
- Year 3: $55,000.
- Year 4: $60,000.
The total benefits are:
$35,000 + $45,000 + $55,000 + $60,000 = $195,000The net return is:
$195,000 - $120,000 = $75,000The total ROI is:
($75,000 / $120,000) × 100 = 62.5%Now calculate payback.
Cumulative balance:
- Year 0: -$120,000.
- Year 1: -$85,000.
- Year 2: -$40,000.
- Year 3: +$15,000.
The project recovers its investment during Year 3.
At the start of Year 3, the remaining unrecovered investment is $40,000. Year 3 cash flow is $55,000.
Fractional year:
$40,000 / $55,000 = 0.73Payback period:
2 + 0.73 = 2.73 yearsThis gives the sponsor a practical view. The project returns more than it costs and pays back in less than three years.
If the finance team also calculates a positive NPV and an IRR above the required return, the business case becomes stronger.
Practical Tips for Project Managers
Financial formulas are only as good as the assumptions behind them. A perfectly calculated ROI is not useful if the benefit estimates are unrealistic.
Here are a few practical tips.
Be Clear About What Counts as a Benefit
Do not mix vague benefits with financial benefits without explaining them.
For example, “better reporting” is valuable, but it is not automatically a cash flow. To include it in ROI or NPV, you need to translate it into measurable value.
That value could come from:
- Reduced labor hours.
- Faster decision-making.
- Lower error correction costs.
- Avoided compliance penalties.
- Reduced software licensing costs.
- Increased sales capacity.
If the benefit cannot be measured financially, you can still include it in the business case. Just do not pretend it is a cash flow unless you can support the number.
Separate Hard Benefits and Soft Benefits
Hard benefits are easier to prove. They usually show up directly in budgets, costs, or revenue.
Examples include:
- Reduced contractor cost.
- Lower maintenance spending.
- Fewer software licenses.
- Increased production output.
- Reduced overtime.
Soft benefits are valuable but harder to measure.
Examples include:
- Better employee experience.
- Improved customer satisfaction.
- Stronger reporting visibility.
- Better decision quality.
- Improved stakeholder confidence.
Soft benefits can support a project, but hard benefits usually carry more weight in financial formulas.
Watch the Timing of Benefits
Timing matters.
A project that delivers benefits in Year 1 is financially different from a project that delivers the same benefits in Year 5.
This is especially important for NPV. Earlier benefits are worth more because they are discounted less.
As a project manager, you may be able to improve the financial case by changing the delivery approach. For example, you may phase the project so the organization receives some benefits earlier.
Include Realistic Costs
Some business cases underestimate costs. That makes the project look better than it really is.
Remember to consider:
- Software costs.
- Hardware costs.
- Consulting costs.
- Internal labor costs.
- Training costs.
- Change management costs.
- Maintenance costs.
- Support costs.
- Transition costs.
A project that looks profitable with incomplete costs may become unattractive once the full cost is visible.
Be Honest About Uncertainty
Future benefits are estimates. They are not guarantees.
If the numbers are uncertain, show a range. You might present conservative, expected, and optimistic scenarios.
For example:
- Conservative case: Payback in 4.2 years.
- Expected case: Payback in 2.8 years.
- Optimistic case: Payback in 2.1 years.
This helps decision-makers understand the risk. It also makes your business case more credible.
Do Not Use One Formula Alone
Each formula has limitations.
ROI is simple but ignores timing. Payback Period is practical but ignores benefits after recovery. NPV is financially strong but depends on the discount rate. IRR is easy to compare but can be misleading with unusual cash flows.
A better approach is to use multiple measures together.
For many projects, a useful combination is:
- ROI to show overall return.
- Payback Period to show recovery time.
- NPV to show value after discounting.
- IRR to show the expected rate of return.
Together, they give a more balanced view.
Common Mistakes to Avoid
One common mistake is using “returns” and “net returns” as if they mean the same thing.
Total benefits are the full amount received. Net return is the amount left after subtracting the initial investment.
Another mistake is calculating ROI without clearly defining the time period. A 50% ROI over one year is not the same as a 50% ROI over ten years.
A third mistake is treating Payback Period as a complete investment decision tool. It is useful, but it does not measure total value.
Another common mistake is forgetting that NPV depends on the discount rate. If the discount rate changes, the NPV changes.
Finally, some teams include benefits that are not really cash flows. This can make the financial case look stronger than it is.
How These Formulas Help You Communicate Better
Project managers often need to influence people without having full authority. Financial language helps because it connects the project to business priorities.
Instead of saying:
This project will improve our reporting process.You can say:
This project is expected to reduce manual reporting effort by $45,000 per year and recover the investment in 2.7 years.That second version is much stronger.
It gives decision-makers something concrete. It also shows that you understand the business side of the project.
You do not need to overload every conversation with formulas. But when you are preparing a business case, charter, steering committee update, or funding request, these measures can make your message more convincing.
Final Thoughts
ROI, Payback Period, NPV, and IRR are not just finance formulas. They are decision-making tools.
They help you understand whether a project makes sense. They help sponsors compare options. They help organizations invest limited resources wisely.
For project managers, the goal is not to become a spreadsheet expert. The goal is to understand what the numbers mean and how they connect to real project decisions.
ROI helps you explain the overall return. Payback Period helps you explain how quickly the investment is recovered. NPV helps you account for the time value of money. IRR helps you express the project’s expected rate of return.
Used together, these formulas give you a stronger way to talk about value. And in project management, that matters.
Because successful projects are not only delivered on time and on budget. They also need to be worth doing in the first place.