
Limited-time Udemy offer
$9.99
Leadership For Project Managers Leading People And Projects
Unlimited redemptions
Available until September 18, 2026 5:09 PM PDT
66D6FD5906E09C4284FE
Chapter 11
When people hear Agile and Earned Value Management in the same sentence, they often pause. Agile is adaptive, lightweight, and focused on delivering customer value quickly. Earned Value Management, or EVM, comes from traditional project management, with strong roots in defense, aerospace, and government contracts. At first glance, these worlds seem far apart. So why should Agile professionals care about EVM? The truth is, many organizations still require EVM reports. If we want Agile to succeed in those environments, we need to learn how to connect the two worlds.
EVM combines scope, schedule, and cost into a single integrated view. In predictive projects, it tells executives whether the project is on time and on budget. Agile has its own ways of measuring progress—velocity, burn charts, and delivered increments. But executives and PMOs often prefer CPI, SPI, and Earned Value numbers. This is where translation becomes powerful. By understanding both approaches, we can present Agile progress in a language stakeholders recognize, while still staying true to Agile principles.
Another important point is that many projects today are hybrid. Some parts use Agile for flexibility and customer feedback, while other parts rely on predictive methods for contracts, procurement, or regulatory reporting. In these projects, data must flow across both systems. Agile progress—such as story points completed—can feed into EVM calculations. Meanwhile, traditional data—such as budgets and baseline schedules—completes the picture. Integrating the two creates a balanced view that satisfies executives, auditors, and Agile teams alike.
Agile teams working in government, finance, or healthcare often cannot escape EVM. PMOs may also require it to maintain consistency across the portfolio. Instead of resisting, the smarter approach is to adapt. You can map backlog items, sprint outcomes, and velocity data into EVM formulas. For example, delivered story points can become the Earned Value, while budgets track the Actual Cost. This allows you to comply with reporting standards while keeping your Agile delivery intact. It is not about giving up Agile—it is about bridging two ways of working.
Learning EVM in an Agile context has big benefits. First, it prevents unnecessary conflict with management. Instead of debating metrics, you can provide both Agile charts and EVM reports. Second, it positions you as a leader who understands both sides. You become the translator, showing how Agile progress ties to financial performance and business outcomes. Over time, this builds trust and opens doors for deeper Agile adoption. In other words, EVM in Agile is less about formulas and more about building credibility across the organization.
EVM in Agile is not about replacing Agile metrics with rigid control methods. It is about creating a shared language for teams and leaders, especially in hybrid or compliance-driven projects. By understanding EVM, you can integrate Agile data with traditional measures, ensuring that both perspectives are represented. This integration strengthens your role as a coach, communicator, and Agile leader. For now, remember: the reason we talk about EVM in Agile is because it helps Agile teams succeed in traditional organizations and hybrid projects.
Earned Value Management, or EVM, is a project performance measurement method that combines scope, schedule, and cost into one integrated view. At its heart, EVM answers three key questions:
By answering these three questions consistently, project leaders can evaluate progress in an objective way, instead of relying only on intuition or status updates.
EVM relies on three core measures: Planned Value, Earned Value, and Actual Cost. Planned Value, or PV, is the budgeted value of the work scheduled to be done at a given time. Earned Value, or EV, is the budgeted value of the work actually completed at that time. Actual Cost, or AC, is how much money was actually spent to perform the work. These three measures form the foundation of all other EVM calculations. To understand EVM, you need to clearly see how each one works.
Imagine your project planned to complete 10 features in the first two sprints, with each feature budgeted at $1,000 dollars of value. By the end of Sprint 2, your Planned Value is 10x$1000=$10,000, because that is what you intended to deliver by that date. PV always comes from your plan—it represents the scheduled progress, not what really happened.
Now let us say that by the end of Sprint 2, only 8 of those features were completed. Each feature was worth $1,000 dollars in planned value. That means your Earned Value is 8x$1000=$8,000 dollars. You planned to earn $10,000, but you only earned $8,000. EV tells you the value of the actual completed work, not the effort spent. This is a key difference. It does not matter if the team worked hard but finished only eight features—the Earned Value reflects only completed deliverables.
Consider a project where 20 story points are planned for a sprint, each point valued at $500 dollars. If the team completes 15 story points, the Earned Value is $7,500 dollars. If they complete all 20, the Earned Value is $10,000 dollars. If they complete only 10, the Earned Value is $5,000. Notice how the Earned Value grows only with work that is one hundred percent done. Partial completion does not count, because in Agile, a feature is either done or not done. This makes Agile teams well aligned with the logic of Earned Value.
Now let us consider Actual Cost. Suppose the team of five people each costs $2,500 per sprint. By the end of the sprint, the Actual Cost is $12,500, no matter how many story points were completed. If 15 story points were delivered, then you can compare: Earned Value was $7,500, Actual Cost was $12,500. That difference highlights whether the project is overspending or underspending for the value it has delivered.
When you put these numbers together, you can evaluate project health. If Earned Value is less than Planned Value, you are behind schedule. If Earned Value is less than Actual Cost, you are over budget. If Earned Value is greater than Actual Cost, you are under budget, which is rare but possible. This simple comparison creates an objective picture of how well the project is performing. And because EVM is based on completed work, it avoids misleading reports where teams are “90 percent done” but have little to show for it.
In traditional project management, Earned Value is calculated against a fixed baseline of scope, cost, and schedule. A baseline is essentially the approved plan—it sets the expectations for what will be delivered, when it will be delivered, and how much it will cost. Once set, the baseline becomes the yardstick for measuring performance. But Agile projects do not operate with fixed baselines in the same way. Features can be added, priorities can shift, and scope is flexible. This means we must adapt how we define and use baselines when applying EVM in Agile.
In Agile, Planned Value can be represented by the number of story points, features, or backlog items expected to be completed in a sprint or release. The sprint plan becomes a type of short-term baseline. For example, if the Product Owner prioritizes 20 story points for Sprint 1, and each point is assigned a monetary value, the Planned Value is the total of those points. Unlike predictive projects where the baseline is locked early, Agile treats each sprint commitment as a rolling baseline that evolves with the backlog.
Earned Value in Agile is the budgeted value of the backlog items actually completed. Because Agile uses the Definition of Done, this becomes straightforward: a user story is either done or not done. For example, if a sprint planned 20 story points but only 15 were completed, the Earned Value is based on those 15 points. Partial credit does not apply. This makes EV in Agile clearer than in predictive projects, where percent complete often involves subjective judgment. In Agile, the evolving backlog ensures that the baseline and EV are always tied to tangible, finished work.
Actual Cost in Agile is usually the cost of the team for the sprint. This is often a fixed figure, based on salaries, tools, and overheads. For example, if a sprint requires a team of six people, each with a cost of $3,000 dollars, then the Actual Cost for that sprint is $18,000. Because Agile teams are usually stable, Actual Cost is consistent and easy to track, making it one of the simplest parts of Agile EVM reporting.
Let’s walk through an example:
Interpretation
The baseline shows what was expected, and EVM compares actual performance to that baseline.
Adapting EVM for Agile provides benefits for both teams and stakeholders. For teams, it means progress is measured based on completed value, not effort or hours. For stakeholders, it means Agile delivery can be expressed in familiar EVM terms. This builds confidence and creates a shared language for performance reporting. It also makes Agile projects easier to integrate into hybrid portfolios where some projects still rely on predictive methods and fixed baselines.
Agile does not need to reject Earned Value Management outright. Instead, by treating sprint commitments as short-term baselines, aligning Planned Value with backlog plans, Earned Value with completed work, and Actual Cost with team expenses, we can adapt EVM to iterative delivery. This allows Agile teams to show progress in a way that resonates with executives and PMOs, while still staying true to Agile principles.
Now that we understand Planned Value, Earned Value, and Actual Cost, it is time to put them to work. The real power of Earned Value Management comes from calculating performance indicators. These indicators help us see whether a project is on schedule, on budget, or facing trouble. In Agile projects, the same formulas can be used, but we apply them to sprint and backlog data. This gives leaders and teams a consistent way to measure performance while still working iteratively.
The first two measures are variances. Schedule Variance, or SV, is calculated as Earned Value minus Planned Value. The formula is SV = EV – PV. If SV is negative, the team is behind schedule. If it is positive, the team is ahead. Cost Variance, or CV, is calculated as Earned Value minus Actual Cost. The formula is CV = EV – AC. If CV is negative, the project is over budget. If it is positive, the project is under budget. These simple calculations tell us whether progress matches the plan and whether spending is aligned with value delivered.
Indexes provide ratios rather than differences. The Schedule Performance Index, or SPI, is calculated by dividing Earned Value by Planned Value. The formula is SPI = EV ÷ PV. A result of one means the team is exactly on schedule. Less than one means behind, greater than one means ahead. The Cost Performance Index, or CPI, is calculated by dividing Earned Value by Actual Cost. The formula is CPI = EV ÷ AC. A result of one means on budget, less than one means over budget, greater than one means under budget. These indexes are easy to interpret and often appear in executive reports.
Schedule Variance (SV) = EV − PV
Cost Variance     (CV) = EV − AC
Schedule Perf. Ix (SPI) = EV ÷ PV
Cost Perf. Index  (CPI) = EV ÷ AC
Apply EVM to an Agile sprint:
Calculations
SV = EV − PV = 7,500 − 10,000 = −2,500 → behind scheduleCV = EV − AC = 7,500 − 12,500 = −5,000 → over budgetSPI = EV ÷ PV = 7,500 ÷ 10,000 = 0.75 → delivered 75% of planned valueCPI = EV ÷ AC = 7,500 ÷ 12,500 = 0.60 → $0.60 of value per $1 spentNext sprint with the same plan:
Calculations
SV = 10,000 − 10,000 = 0 → on scheduleCV = 10,000 − 12,500 = −2,500 → over budgetSPI = 10,000 ÷ 10,000 = 1.00 → on planCPI = 10,000 ÷ 12,500 = 0.80 → $0.80 of value per $1 spentPerformance improved versus Sprint 1 (schedule recovered), but costs remain above value delivered.
In Agile projects, these formulas work the same way as in predictive projects, but the interpretation is different. A low SPI might reflect ambitious sprint planning rather than real delay. A low CPI might reflect upfront investment in infrastructure that delivers value later. That is why we should use these indicators as signals to investigate, not absolute judgments. Pairing them with Agile-native measures such as burndown charts or retrospectives provides a more complete picture.
EV < PV → behind schedule;
EV = PV → on plan;
EV > PV → ahead of plan.
EV < AC → overspending (cost risk);
EV = AC → on budget;
EV > AC → underspending / cost-efficient.
SPI = EV ÷ PV → < 1 behind; = 1 on plan; > 1 ahead.
CPI = EV ÷ AC → < 1 cost-inefficient / over budget; = 1 on budget; > 1 cost-efficient / under budget.
Key metrics like SV, CV, SPI, and CPI bring objectivity to Agile performance reporting. They translate completed backlog work and team costs into numbers that executives understand. At the same time, Agile leaders must interpret them carefully, remembering that incremental and adaptive delivery changes the story behind the numbers.
Earned Value Management produces financial metrics. Agile produces progress charts. On their own, each view is useful but incomplete. EVM shows cost efficiency and schedule adherence, but it does not reveal scope changes or team flow. Agile charts show story point progress and dynamics, but they do not connect directly to budget. By linking points to cost, we can bridge both worlds. For example, if a sprint plans 10 points with a Planned Value of 1,000 dollars, each point is worth 100 dollars. This creates a common language: story points for teams, dollars for executives. Combining these perspectives creates a dual view of project health.
The most common Agile charts are burndown, burnup, and cumulative flow diagrams. A burndown chart shows remaining work. A burnup chart shows completed work, plus the scope line, which makes scope changes visible. A cumulative flow diagram shows distribution of work in progress and highlights bottlenecks. These charts are clear to teams but do not tie directly to cost. If Sprint One planned 10 points (PV = 1,000), and the team only completed 7 points, the burnup chart shows 7 points done. By assigning each point 100 dollars, we can also calculate EV = 7 ÷ 10 × 1,000 = 700 dollars. This links the Agile chart to financial language.
EVM uses Planned Value, Earned Value, and Actual Cost to calculate performance metrics. Planned Value is the budgeted cost of scheduled work. Earned Value is the budgeted cost of completed work. Actual Cost is what the team really spent. Suppose Sprint One planned 10 points at a total budget of 1,000 dollars. Each point is 100 dollars. If 7 points were completed, EV = 700. If team cost (AC) was 1,200 dollars, then CPI = 700 ÷ 1,200 ≈ 0.58, showing poor cost efficiency. SPI = 700 ÷ 1,000 = 0.70, showing only 70% of planned value delivered. This shows how metrics translate Agile progress into financial signals.
The opportunity comes when EVM data is layered onto Agile charts. In a burnup chart, the progress line (points completed) can also be expressed as Earned Value in dollars. Planned Value can be shown as a rising line based on budgeted story points. Actual Cost can be plotted as a cumulative cost curve. For example, if by Sprint Two the team completed 15 points out of 20 planned (EV = 1,500, PV = 2,000), the burnup chart shows 15 points completed, while the EVM layer shows a 500-dollar shortfall. A cumulative flow diagram can also be annotated with CPI values, showing how efficiency trends align with flow stability.
For teams, Agile charts make work visible and intuitive. For executives, EVM ties that work to dollars, enabling financial accountability. By presenting both together, we reduce misinterpretation. A negative variance on its own may look like poor performance, but the burnup chart might reveal scope increases that explain the difference. When each point is tied to cost, Agile progress becomes directly translatable into financial terms. This dual approach builds trust, satisfies compliance needs, and respects Agile values.
Agile charts and EVM are not rivals—they are complementary. By linking story points to cost, each Agile chart becomes more meaningful for financial stakeholders, and each EVM report becomes more transparent for teams. Together, they provide a full picture of progress, cost, and scope. This dual view is especially valuable in hybrid environments, where PMOs demand Earned Value reports and Agile teams rely on visual flow metrics.
Now that we understand how EVM and Agile charts complement each other, let us practice combining them. We will use a three-sprint release as our example. Each sprint has story points, planned value, earned value, and actual costs. From these numbers, we can calculate EVM metrics and overlay them onto burn charts. Let us walk through this process step by step.
Plan: 20 story points → $10,000 Planned Value (PV). Team delivered 15 story points → $7,500 Earned Value (EV). Actual Cost (AC) = $12,500.
EV ÷ PV = 7,500 ÷ 10,000 = 0.75EV ÷ AC = 7,500 ÷ 12,500 = 0.60Burnup view: Scope line at 20 points; progress rises to 15. Less work completed than planned. EVM confirms schedule slippage and overspending.
Plan: 20 story points → $10,000 PV. Team delivered 20 points → EV = $10,000. AC = $12,500.
10,000 ÷ 10,000 = 1.00 (on plan)10,000 ÷ 12,500 = 0.80Burnup view: Progress line reaches planned work. Team delivered everything; EVM shows cost inefficiency but improved performance versus Sprint 1.
Plan: 20 story points, but mid-sprint scope increased by 10 points. New total scope line rises from 60 to 70 points overall. Team delivered 20 points → EV = $10,000. PV for the sprint increased to $15,000. AC = $12,500.
EV ÷ PV = 10,000 ÷ 15,000 = 0.67EV ÷ AC = 10,000 ÷ 12,500 = 0.80Burnup view: Progress rises, but scope rises faster, creating a visible gap (schedule pressure), while cost efficiency remains below 1.0.
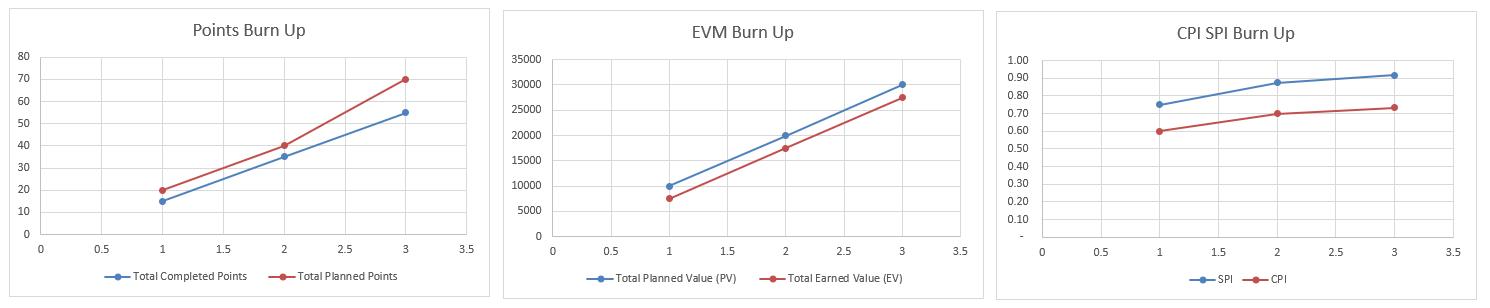
By combining EVM metrics with Agile charts, we see both the financial and the delivery story. The burnup chart explains why SPI dipped in Sprint Three: scope increased. EVM provided hard numbers on cost and schedule, while Agile charts made scope changes and flow visible. Together, they give stakeholders the full picture of what happened across the release.
Building EVM-based burn charts is about layering numbers and visuals. Planned Value, Earned Value, and Actual Cost feed SPI and CPI. These metrics can be annotated onto burndown or burnup charts to explain variances. By practicing with real data, teams learn to tell a consistent story that satisfies executives and empowers Agile teams. This is the strength of combining EVM and Agile charts—it creates one version of the truth for all stakeholders.
Cost Variance (CV), Schedule Variance (SV), Cost Performance Index (CPI), and Schedule Performance Index (SPI) are the backbone of Earned Value Management. They convert Planned Value (PV), Earned Value (EV), and Actual Cost (AC) into actionable signals. In Agile projects, we calculate them at sprint or release boundaries, then interpret them with burn charts and team insights. Used well, these metrics reveal whether value delivery matches expectations, whether spending aligns with outcomes, and where coaching or replanning is needed.
In Agile, sprint commitments act as short-term baselines. A story is either done or not done. These inputs keep calculations objective, because value only increases when work meets the Definition of Done.
Keep these handy during examples, and focus on interpretation as much as arithmetic.
| SPI | CPI | Schedule | Cost | Plain-English Read |
|---|---|---|---|---|
| > 1 | > 1 | ahead | under budget | Faster than plan and spending efficiently. |
| > 1 | < 1 | ahead | over budget | Good speed, but spending too much to get it. |
| < 1 | > 1 | behind | under budget | Slow progress, but spending less than expected. |
| < 1 | < 1 | behind | over budget | Slow and costly—needs immediate attention. |
| = 1 | = 1 | on plan | on budget | Tracking exactly to plan and budget. |
This is a straightforward sprint. Each story point is budgeted at $500. The sprint plan is 20 points. The team completes 18 points. Team cost for the sprint is $12,000.
Interpretation: The sprint delivered 90% of planned value and overspent. Use a burndown to check scope ambition, review blockers, unplanned work, or quality issues that consumed budget without earning value.
Each sprint plans 20 points; each point carries $500 of planned value. Scope increases by 10 points during Sprint Three.
Interpretation: The burnup shows a rising scope line in Sprint Three. The team met sprint plans, but scope growth widened the gap to total completion. SPI < 1 reflects added scope, not weak execution. CPI < 1 reflects sustained cost pressure that needs action in planning or staffing.
Context: Sprint 1 includes a tool purchase, and features have different planned values.
Note: These are budgeted values (fixed), not time-and-materials.
One-time costs can distort a single sprint’s CPI—cumulative views matter.
Interpretation: Schedule lags because Sprint One slipped. Cost performance is healthy overall because the upfront tool cost is amortized across both sprints. Use a burnup to show steady throughput and a falling gap to the scope line in Sprint Two.
When your organization expects a forecast, you can use Agile-friendly EVM shortcuts. Keep them lightweight, re-check them often, and pair them with burnup/velocity trends.
VAC = BAC − EAC.CPI = EV ÷ AC.SPI = EV ÷ PV.EAC = AC + (BAC − EV) ÷ CPIEAC = AC + (BAC − EV) ÷ (CPI × SPI)ETC = EAC − ACVAC = BAC − EACAssume: Budget at Completion (BAC) for the release = $120,000.
Current cumulative status after 4 sprints:
EV ÷ AC = 72,000 ÷ 90,000 = 0.80EV ÷ PV = 72,000 ÷ 80,000 = 0.90 EAC = AC + (BAC − EV) ÷ CPI
= 90,000 + (120,000 − 72,000) ÷ 0.80
= 90,000 + 48,000 ÷ 0.80
= 90,000 + 60,000
= $150,000
VAC = BAC − EAC = 120,000 − 150,000 = −$30,000 (projected overrun)
 EAC = AC + (BAC − EV) ÷ (CPI × SPI)
 = 90,000 + 48,000 ÷ (0.80 × 0.90)
 = 90,000 + 48,000 ÷ 0.72
 = 90,000 + 66,667
 = $156,667
Earned Value Management is powerful, but it is not perfect. Especially in Agile, where work is iterative and scope can change frequently, EVM may not always tell the full story. Understanding the limitations of EVM is just as important as learning the formulas. By knowing where it struggles, Agile leaders can avoid misuse and explore alternative ways to measure performance.
EVM was designed for projects with fixed baselines—clear scope, schedule, and budget defined at the start. Agile projects, however, welcome changing scope and adaptive plans. This means that Planned Value and Earned Value may shift over time, sometimes making EVM reports look negative even when the team is performing well. In fast-changing projects, baselines can become outdated quickly.
EVM measures progress in terms of planned deliverables completed, not necessarily customer value. A feature can be finished and earn value in EVM terms, but if customers do not use it, real value is low. Agile emphasizes delivering outcomes, not just outputs. This gap means EVM should not be the only measure of success.
In Agile projects, one sprint with unplanned costs or a delayed feature can make CPI or SPI look poor. But cumulative results over several sprints may balance out. This volatility can mislead stakeholders if metrics are taken at face value. Teams should always interpret EVM alongside charts like burnups or cumulative flow diagrams to see the larger trend.
Another limitation is complexity. EVM requires careful tracking of PV, EV, and AC. For small Agile teams, this can feel like bureaucracy. If reporting takes more time than delivery, the team loses focus. Leaders must balance the need for EVM with the Agile principle of simplicity.
Agile teams often prefer lightweight measures that track value directly. Common alternatives include burnup and burndown charts, which visualize progress against scope. Cumulative flow diagrams show flow and predictability. Velocity trends show sustainable throughput. Cycle time and lead time track how quickly features move from idea to delivery. These metrics align closely with Agile principles and require less overhead than EVM.
Beyond delivery metrics, Agile organizations often use value-focused tools. Weighted Shortest Job First (WSJF) helps prioritize features for maximum economic impact. OKRs, or Objectives and Key Results, link delivery to strategic goals. Business value scoring ties backlog items to outcomes that matter most to stakeholders. These approaches measure not just how much is delivered, but whether it creates impact.
The best approach is often hybrid. Use EVM when stakeholders or PMOs require cost and schedule performance data. Pair it with Agile-native charts and value-based techniques to complete the picture. This way, you provide executives with the language they understand while still staying true to Agile values. Reporting becomes a bridge rather than a battle.
Earned Value Management has its place in Agile, but it is not a silver bullet. Its limitations are real: rigid baselines, focus on output over outcome, and potential complexity. The alternatives—Agile-native metrics and value-based prioritization—offer flexibility and direct customer focus. The most effective Agile leaders know when to use EVM, when to supplement it, and when to rely on simpler tools. By combining approaches, you ensure reporting drives better decisions without undermining Agile principles.
By now, you know how to calculate CV, SV, CPI, and SPI, and how to combine them with Agile charts. But there is a problem: doing this manually is time-consuming, error-prone, and often intimidating for non-financial stakeholders. This is where Artificial Intelligence becomes a practical ally. Instead of crunching numbers by hand or building complex spreadsheets, you can delegate the heavy lifting to AI. The real value lies not only in fast calculations, but in how AI can explain the results in plain language. This presents two practical prompts you can use immediately: one for sprint-level reporting, and another for multi-sprint scenario analysis.
When working with Agile and Scrum teams, prompts like the Sprint Report Generator provide a structured way to analyze performance using Earned Value Management (EVM). This prompt takes in the basic sprint data—Planned Value (PV), Earned Value (EV), and Actual Cost (AC)—and guides ChatGPT to calculate core metrics such as Cost Variance (CV), Schedule Variance (SV), Cost Performance Index (CPI), and Schedule Performance Index (SPI). By presenting results in a simple table format, the team gains both numbers and interpretations in plain language, making performance insights clear even for non-financial stakeholders.
The Sprint Report Generator prompt is especially useful in bridging Agile practices with traditional project management expectations. Agile teams are accustomed to metrics like velocity and burndown charts, while executives or sponsors often ask for financial indicators of performance. This prompt helps translate sprint outcomes into measurable cost and schedule health indicators. For example, a negative CV signals overspending, while an SPI below 1 indicates the team is behind schedule. These insights, framed in simple explanations, create alignment between team-level performance and organizational reporting needs.
Moving beyond a single sprint, the Multi-Sprint Scenario Analyzer prompt introduces a broader, release-level perspective. By inputting three sets of sprint data, ChatGPT can generate both sprint-by-sprint metrics and cumulative totals across the release. This highlights trends over time—such as whether cost efficiency is improving, staying flat, or deteriorating—and whether the team is catching up on schedule performance. The prompt also requires an executive summary, giving teams a concise narrative to present at PMO reviews or stakeholder updates, highlighting risks, patterns, and suggested actions.
Together, these prompts help Agile practitioners combine traditional EVM with Agile transparency. The Sprint Report Generator supports day-to-day sprint reflections, while the Multi-Sprint Analyzer informs release-level decisions and resource planning. Used regularly, they encourage balanced reporting: numbers backed by interpretation, trends explained alongside raw data, and actionable insights that stakeholders can trust. This dual approach not only helps teams improve but also strengthens organizational confidence in Agile delivery.
AI does not replace Agile reporting—it accelerates it and makes it more accessible. With prompts like the Sprint Report Generator and the Scenario Analyzer, you can produce EVM calculations instantly and translate them into actionable insights. The key is not only feeding the right data, but also asking the right questions. By integrating AI into your reporting toolkit, you reduce manual effort, increase clarity, and free yourself to focus on what really matters: guiding your team and delivering value.
If you’re new to EVM, it can feel overwhelming. For additional clarification, explore these blog articles that explain EVM within a traditional project management framework:
Lead with clarity, confidence, and real impact. This Leadership for Project Managers course turns day-to-day challenges—unclear priorities, tough stakeholders, and cross-functional friction—into opportunities to guide teams and deliver outcomes that matter.
You’ll learn practical leadership skills tailored to project realities: setting direction without overcontrol, creating alignment across functions, and building commitment even when authority is limited. We go beyond theory with tools you can use immediately—one-sentence visioning, stakeholder influence maps, decision framing, and feedback scripts that actually land.
Expect hands-on frameworks, real-world examples, and guided practice to prepare for tough moments—executive readouts, resistance from stakeholders, and high-stakes negotiations. Downloadable templates and checklists keep everything actionable when the pace gets intense.
Learn alongside professionals around the world working in project leadership and delivery.
Explore the CourseHK School of Management helps you apply AI to Agile work with practical, prompt-based workflows for real-world Scrum challenges. Practical skills, tools, and guidance you can apply right away. Covered by Udemy's 30-day refund policy.
Learn MoreUnlimited redemptions
Available until September 18, 2026 5:09 PM PDT
66D6FD5906E09C4284FE