How to Build Burnup Charts
How to Build a Sprint Burnup Chart (Using the Template)
A burnup chart shows how much work has been completed over time compared to the total scope. It’s great for visualizing progress and for making scope changes visible. This guide explains how to fill in the Excel template and produce a clear burnup chart.
Donwload templates in Downlaods
What’s in the Template
- Day – Sprint day number (starts at 0).
- Completed Planned – Story points you plan to complete on that day.
- Completed Actual – Story points actually completed on that day.
- Cumulative Planned – Running total of planned completed points.
- Cumulative Actual – Running total of actual completed points.
- Total Scope – The current scope line (can change if scope goes up or down).
Before You Start
- Total sprint scope (sum of committed story points at Sprint Planning).
- Sprint length (how many days you’ll track).
- Daily plan (even distribution or capacity-based plan by day).
Step 1 — Set the Sprint Length
- Open the template and check the Day column.
- Extend or trim it to match your sprint (for example, Day 0 to Day 10 for an 11-day sprint).
- If you track weekends, keep them and plan 0 for those days as needed.
Step 2 — Enter Total Scope
- In the Total Scope column, enter your initial scope (e.g., 460) for all rows of the sprint.
- This creates a flat scope line. You will adjust it later if scope changes.
Step 3 — Plan Daily Completions
Fill the Completed Planned column for each day (not Day 0). Two common options:
- Even plan: total_scope ÷ number_of_days (e.g., 460 ÷ 23 ≈ 20 per day).
- Capacity-based plan: vary the numbers by team availability (e.g., 0 on weekends, more on focus days).
Step 4 — Calculate Cumulative Planned
Use a running sum so the planned completion grows over time. Assuming headers are in row 1 and data begins in row 2, and these columns:
- A: Day
- B: Completed Planned
- C: Completed Actual
- D: Cumulative Planned
- E: Cumulative Actual
- F: Total Scope
Example formulas (adjust to your sheet):
- In D2 (Day 0):
=0 - In D3 (Day 1):
=D2 + B3, then copy down to the last day.
Step 5 — Track Actual Completion Daily
- Each day, enter what was completed in Completed Actual (column C).
- Calculate Cumulative Actual with a running sum:
- In E2 (Day 0):
=0 - In E3 (Day 1):
=E2 + C3, then copy down.
- In E2 (Day 0):
Step 6 — Handle Scope Changes
- Scope increase: On the day scope rises by, say, 20 points, update Total Scope from that day onward by
+20(e.g., replace remaining rows in column F with the new higher value). - Scope decrease: Similarly, reduce Total Scope from that day onward by the removed points.
- This creates a stepped scope line so changes are visible on the chart.
Step 7 — Create (or Refresh) the Chart
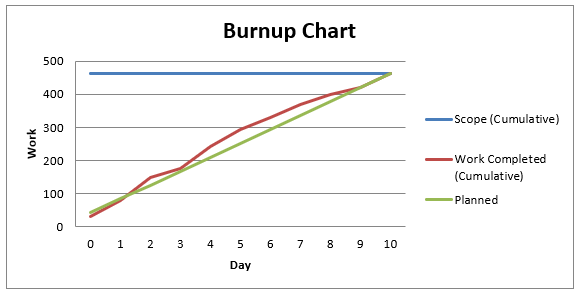
- Select Day, Cumulative Planned, Cumulative Actual, and Total Scope columns.
- Insert a Line chart (or “Line with markers”).
- Ensure the X-axis is Day and the three series are:
- Cumulative Planned (planned progress)
- Cumulative Actual (actual progress)
- Total Scope (scope line)
- Give the chart a clear title (e.g., “Sprint 14 Burnup”).
How to Read the Burnup
- Cumulative Actual grows upward as work is completed.
- Total Scope shows your finish line; if it moves, scope changed.
- Cumulative Planned is your target trajectory. If actual is below it, you’re behind plan; if above, you’re ahead.
Common Real-World Situations
- Weekends / Holidays: Put 0 in Completed Planned and Completed Actual for those days. The cumulative lines will flatten naturally.
- Partial completions: Only add points when items meet your “Done” definition, unless your team explicitly allows partials.
- Late discoveries: If new work appears, reflect it by raising the Total Scope line from that day onward.
Quality Checks
- The final Cumulative Planned value on the last day should be less than or equal to the final Total Scope. If you planned to finish everything, it should match the final scope.
- The final Cumulative Actual shows how much was truly completed. If it’s below the final scope, you have carryover.
- If cumulative values don’t look right, re-check the running-sum formulas and cell references.
Daily Routine
- At day’s end, update Completed Actual.
- Adjust Total Scope if scope changed that day.
- Glance at the chart: Is Cumulative Actual trending toward the scope line?
Tips for Better Forecasting
- Use the gap between Cumulative Actual and Total Scope to discuss likelihood of finishing on time.
- Watch for scope creep; the Total Scope line will make it visible immediately.
- Refine next sprint’s plan using recent actual throughput (velocity).
Summary
Fill daily Completed Planned and Completed Actual, let the template calculate Cumulative Planned and Cumulative Actual, and keep Total Scope accurate—especially when scope changes. The burnup chart then gives a truthful picture of progress versus scope so you can make better, earlier decisions.
| Day | Scope (Cumulative) | Scope | Work Complete | Work Completed (Cumulative) |
|---|---|---|---|---|
| 0 | 462 | 42 | 32 | 32 |
| 1 | 462 | 84 | 46 | 78 |
| 2 | 462 | 126 | 70 | 148 |
| 3 | 462 | 168 | 28 | 176 |
| 4 | 462 | 210 | 66 | 242 |
| 5 | 462 | 252 | 52 | 294 |
| 6 | 462 | 294 | 37 | 331 |
| 7 | 462 | 336 | 39 | 370 |
| 8 | 462 | 378 | 30 | 400 |
| 9 | 462 | 420 | 20 | 420 |
| 10 | 462 | 462 | 42 | 462 |
Advanced Lean Six Sigma — Data-Driven Excellence
Solve complex problems, reduce variation, and improve performance with confidence. This course is designed for professionals who already know the basics and want to apply advanced Lean Six Sigma tools to real business challenges.
This is not abstract statistics or theory-heavy training. You’ll use Excel to perform real analysis, interpret results correctly, and apply tools like DMAIC, SIPOC, MSA, hypothesis testing, and regression without memorizing formulas or relying on expensive software.
You’ll learn how to measure baseline performance, analyze process capability, use control charts to maintain stability, and validate improvements using statistical evidence. Templates, worked examples, and structured walkthroughs help you apply each concept immediately.
Learn through a complete, real-world Lean Six Sigma project and develop the skills to lead data-driven improvements with credibility. If you’re ready to move beyond basics and make decisions backed by data, enroll now and take your Lean Six Sigma expertise to the next level.
Explore the Course
Build the Sprint Reporting System, Not Another Prompt
AI Systems with Claude is our own course for Scrum Masters and Agile Project Managers, taught against one running project across seven sections. You build five working systems and keep them: the sprint report machine, the retro intelligence system, the stakeholder comms engine, the backlog health monitor, and the risk and dependency tracker. Direct from HK School of Management, not on Udemy.
See What Is Included