How to Build Cummulitive Charts
The Competitive Edge for Modern Project Managers
How to Build a Cumulative Flow Diagram (Using the Template)
A Cumulative Flow Diagram (CFD) visualizes how work items move through your workflow over time. It helps you spot bottlenecks, manage Work in Progress (WIP), and understand throughput and lead time trends. This guide shows how to fill the Excel template and produce a clear CFD.
Donwload templates in Downlaods
What’s in the Template
- Day (or Date) – The daily time index for your sprint or flow-based period.
- Workflow columns – State counts for each day, typically:
- Backlog (not yet committed)
- To Do (committed, not started)
- In Progress
- Review / Test (optional, if you use it)
- Done (completed)
Important: Each workflow state should be a count of items at the end of that day. The chart will stack these counts to show cumulative totals.
Before You Start
- Define your workflow states (columns) in the exact order work flows from left to right.
- Decide the tracking period (e.g., 10–20 working days for a sprint, or a continuous monthly window for Kanban).
- Agree on a daily cutoff time (e.g., 5:00pm). You’ll record state counts as of that time each day.
Step 1 — Set the Timeline
- In the Day/Date column, list each day you’ll track.
- If you do not work weekends, either omit them or include them with repeated counts from the previous working day (so the chart stays continuous).
Step 2 — Record Daily State Counts
- At your cutoff time each day, count the number of items in each state:
- How many are in Backlog?
- How many are in To Do?
- How many are In Progress?
- How many are in Review/Test (if used)?
- How many are Done?
- Enter those counts into the row for that day. Do not enter daily deltas; enter the current counts per state.
Step 3 — Validate the Totals
Optionally, add a check column to ensure the sum of all states equals the current total scope for that day:
- If your state columns are in B:E (Backlog, To Do, In Progress, Done), use a check like
=SUM(B2:E2)for each row. - If scope grows or shrinks, the total will change. That’s okay—CFDs show this clearly.
Step 4 — Create the Cumulative Flow Chart (Stacked Area)
- Select the full table (Day/Date plus all state columns for all days).
- Insert a Stacked Area chart:
- X-axis: Day/Date
- Series: Each workflow state (Backlog, To Do, In Progress, Review/Test, Done)
- Order the series in the same left-to-right flow as your process. Typically, Backlog at the bottom and Done at the top (or vice versa) as long as you remain consistent.
- Name the chart (e.g., “Sprint 14 Cumulative Flow Diagram”).
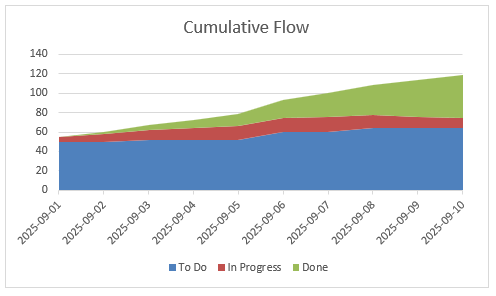
How to Read the CFD
- Band thickness = WIP in that state. A thicker band means more items are sitting in that column.
- Overall height = total scope. If the top of the chart rises, scope is increasing; if it falls, scope is decreasing.
- Done band slope = throughput. The steeper the top edge of the Done band, the faster you finish items per day.
- Horizontal distance of a band ≈ lead time in that state. If items spend many days in a column, that band stretches horizontally.
Daily Workflow and Updates
- At the end of each day, update the counts for each state.
- Refresh the chart (it will update automatically if it references the table range).
- Call out any sudden band changes (scope added/removed, blockage resolved, policy changed, etc.).
Common Real-World Situations
- Scope changes: If new items are added to Backlog or To Do, the total height increases. If items are removed, it decreases. This is normal and visible in the CFD.
- Blocked items: If In Progress (or Review/Test) band thickens over several days, you likely have a bottleneck. Investigate causes and reduce WIP.
- WIP limits: If you enforce limits per column, large band growth signals the limit was exceeded or items are not flowing smoothly.
- Partial days: If you miss a day, duplicate the last known counts to keep the chart continuous (note it in your log).
Optional Calculations (Helpful Metrics)
- Daily Throughput: Approximate as the daily increase in Done (e.g.,
Done_today - Done_yesterday). - Average WIP: Average of daily counts in In Progress (or sum across active states) over your period.
- Little’s Law (rough check): Average Lead Time ≈ Average WIP ÷ Average Throughput. Use as a trend indicator, not an absolute.
Quality Checks
- Monotonic Done: The Done count should never decrease over time.
- No negative counts: All state counts must be zero or positive integers.
- Consistent totals: The sum of all states each day should match your real total for that day.
- Correct series order: Ensure states are stacked in process order; it makes the CFD easier to interpret.
Interpretation Tips
- If In Progress grows while Done stays flat, items are starting but not finishing—reduce WIP, swarm, or remove blockers.
- If Review/Test balloons, you may have a testing or QA bottleneck—rebalance skills or adjust policies.
- If the top line rises rapidly, scope is expanding—reassess goals and capacity or renegotiate scope.
- A steady climb in Done with stable WIP bands usually indicates a healthy, predictable flow.
Keeping the CFD Useful
- Update it daily at the same time.
- Discuss it in standups or reviews to make flow issues visible early.
- Pair it with explicit WIP limits and clear “Definition of Done” to maintain quality and predictability.
Summary
Record daily counts per workflow state, insert a Stacked Area chart, and keep the series ordered by your process flow. Read band thickness for WIP, top-line height for scope, and the Done slope for throughput. Use what you see to manage bottlenecks, control WIP, and improve predictability.
| Date | To Do | In Progress | Done |
|---|---|---|---|
| 2025-09-01 | 50 | 5 | 0 |
| 2025-09-02 | 50 | 8 | 2 |
| 2025-09-03 | 52 | 10 | 5 |
| 2025-09-04 | 52 | 12 | 8 |
| 2025-09-05 | 52 | 14 | 13 |
| 2025-09-06 | 60 | 15 | 18 |
| 2025-09-07 | 60 | 16 | 24 |
| 2025-09-08 | 64 | 14 | 30 |
| 2025-09-09 | 64 | 12 | 38 |
| 2025-09-10 | 64 | 10 | 45 |
Advanced Lean Six Sigma — Data-Driven Excellence
Solve complex problems, reduce variation, and improve performance with confidence. This course is designed for professionals who already know the basics and want to apply advanced Lean Six Sigma tools to real business challenges.
This is not abstract statistics or theory-heavy training. You’ll use Excel to perform real analysis, interpret results correctly, and apply tools like DMAIC, SIPOC, MSA, hypothesis testing, and regression without memorizing formulas or relying on expensive software.
You’ll learn how to measure baseline performance, analyze process capability, use control charts to maintain stability, and validate improvements using statistical evidence. Templates, worked examples, and structured walkthroughs help you apply each concept immediately.
Learn through a complete, real-world Lean Six Sigma project and develop the skills to lead data-driven improvements with credibility. If you’re ready to move beyond basics and make decisions backed by data, enroll now and take your Lean Six Sigma expertise to the next level.

Build complete project plans in minutes with AI
Stop spending hours on documentation. Learn how to use AI to create charters, WBS, schedules, risk registers, and executive reports faster—while staying fully in control. This course gives you ready-to-use prompt templates and practical workflows based on real project work. No guesswork, no fluff—just tools you can apply immediately. Backed by Udemy’s 30-day money-back guarantee, so you can start risk-free.
Learn More