How to Build Burndown Charts
The Competitive Edge for Modern Project Managers
How to Build a Sprint Burndown Chart (Using the Template)
The burndown chart shows how much work remains in a sprint and helps you see if the team is on track. This guide walks you through filling in the provided Excel template and producing a clean, useful burndown.
Donwload templates in Downlaods
What’s in the Template
- Day – Sprint day number (starts at 0).
- Burned Down Planned – How many story points you plan to finish that day.
- Burned Down Actual – How many story points the team actually finished that day.
- Balance Planned – Remaining story points if you follow the plan.
- Balance Actual – Remaining story points based on actual progress.
Before You Start
- Total sprint scope (sum of story points you committed at Sprint Planning).
- Sprint length (number of calendar or working days you want to track).
- Daily capacity plan (how many points you intend to complete each day—can be even or varied).
Step 1 — Set Sprint Length
- Open the template and look at the Day column.
- Extend or trim the list so it covers your sprint (e.g., Day 0 to Day 10 for an 11-day sprint).
- If you don’t work weekends, you can still keep the days; just plan 0 for those dates (see next step).
Step 2 — Enter the Total Scope on Day 0
- In Balance Planned for Day 0, enter the total story points (e.g., 460).
- In Balance Actual for Day 0, enter the same total (e.g., 460).
This sets the starting point for both the planned and actual lines.
Step 3 — Plan Your Daily Burn
Fill the Burned Down Planned column for each sprint day (not Day 0). You have two common options:
- Even plan: total_scope ÷ number_of_days (e.g., 460 ÷ 23 ≈ 20 per day). Put that daily number in each row.
- Capacity-based plan: assign different planned values per day (e.g., 0 on weekends, higher on big-focus days).
Step 4 — Let the Planned Balance Calculate
Use a simple running subtraction so planned remaining work drops as planned burn occurs. If your headers are in row 1 and data starts in row 2, columns are typically:
- A: Day
- B: Burned Down Planned
- C: Burned Down Actual
- D: Balance Planned
- E: Balance Actual
Typical formulas (adapt to your sheet rows if needed):
- In D2 (Day 0): enter your total scope (e.g.,
460). - In D3 (Day 1):
=D2 - B3, then copy down the column.
Step 5 — Track Actual Burn Daily
- Each day, enter what was truly completed in Burned Down Actual for that day (column C).
- Let Balance Actual recalculate using a running subtraction. Typical setup:
- In E2 (Day 0): enter your total scope again (e.g.,
460). - In E3 (Day 1):
=E2 - C3, then copy down the column.
- In E2 (Day 0): enter your total scope again (e.g.,
Step 6 — Create (or Refresh) the Chart
- Select the Day column and both Balance Planned and Balance Actual columns (Day vs. the two balances).
- Insert a Line chart (or “Line with markers”).
- Ensure the X-axis is Day and the two series are Balance Planned and Balance Actual.
- Give the chart a clear title (e.g., “Sprint 14 Burndown”).
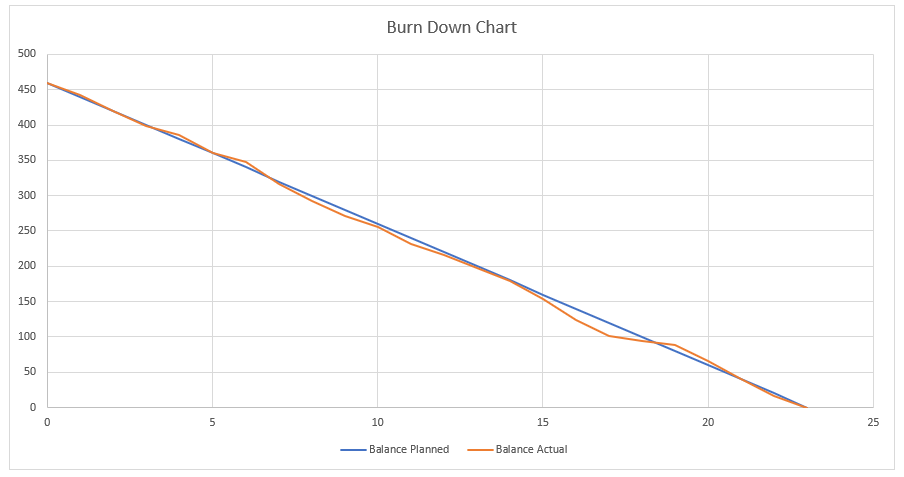
How to Read the Chart
- Balance Planned should slope steadily down to 0 by the last day.
- Balance Actual shows reality. If it stays above the plan, you’re behind; if it’s below, you’re ahead.
Handling Common Real-World Situations
- Weekends / Holidays: Put 0 in Burned Down Planned for those days. The planned line will flatten accordingly.
- Scope increase (new story points added): Add a negative value in Burned Down Actual on the day scope changed (e.g.,
-20). This raises the actual balance line, showing more work remaining. - Scope decrease (stories removed): Add that amount as a positive value in Burned Down Actual (e.g.,
+15) to reduce remaining work appropriately. - Partial completions: Only count story points when the story meets your “Done” definition. Avoid burning partials unless your team explicitly agrees to do so.
Quality Checks
- The last planned balance (last day in Balance Planned) should be 0 if you planned to finish the entire scope.
- The last actual balance (last day in Balance Actual) shows what truly remains. If it’s not 0, discuss carryover at Sprint Review/Retrospective.
- If balances don’t update, re-check that the formulas reference the correct rows.
Optional Refinements
- Labels: Add data labels to show remaining points on key days.
- Target line: Keep Balance Planned as your “ideal” line; it’s already serving as the target.
- Working days only: You can list only working days in the Day column; just ensure plan/actual balances run correctly.
Daily Routine to Keep It Useful
- At day’s end, update Burned Down Actual with the points truly completed.
- Confirm the chart looks right (actual line trending toward 0).
- Call out scope changes so the team understands why the line moved.
Tips for Better Forecasting
- Use the burndown trend to spot risk early (flat or rising actual line needs attention).
- Discuss blockers each day; remove them quickly to restore burn rate.
- Keep planned burn realistic; adjust next sprint’s plan using recent velocity.
Summary
Populate Burned Down Planned with your daily plan, log real progress in Burned Down Actual, and let the template calculate Balance Planned and Balance Actual. The chart then tells the story: if the actual line tracks the plan, you’re on pace; if not, investigate and adapt. Keep it updated daily, and your sprint visibility will improve dramatically.
| Day | Burned Down Planned | Burned Down Actual | Balance Planned | Balance Actual |
|---|---|---|---|---|
| 0 | 460 | 460 | ||
| 1 | 20 | 18 | 440 | 442 |
| 2 | 20 | 22 | 420 | 420 |
| 3 | 20 | 22 | 400 | 398 |
| 4 | 20 | 12 | 380 | 386 |
| 5 | 20 | 25 | 360 | 361 |
| 6 | 20 | 14 | 340 | 347 |
| 7 | 20 | 30 | 320 | 317 |
| 8 | 20 | 25 | 300 | 292 |
| 9 | 20 | 21 | 280 | 271 |
| 10 | 20 | 16 | 260 | 255 |
| 11 | 20 | 23 | 240 | 232 |
| 12 | 20 | 16 | 220 | 216 |
| 13 | 20 | 18 | 200 | 198 |
| 14 | 20 | 19 | 180 | 179 |
| 15 | 20 | 25 | 160 | 154 |
| 16 | 20 | 30 | 140 | 124 |
| 17 | 20 | 23 | 120 | 101 |
| 18 | 20 | 7 | 100 | 94 |
| 19 | 20 | 6 | 80 | 88 |
| 20 | 20 | 22 | 60 | 66 |
| 21 | 20 | 25 | 40 | 41 |
| 22 | 20 | 25 | 20 | 16 |
| 23 | 20 | 16 | 0 | 0 |
AI for Agile Project Managers and Scrum Masters
Become an AI-first leader and transform your agile practice by leveraging artificial intelligence as your most powerful co-pilot. This course is designed to help you drive efficiency, insight, and innovation, ensuring you stay at the forefront of a rapidly evolving project management landscape.
This isn't about replacing human intuition—it's about augmenting it. You'll master prompt engineering to automate mundane tasks, freeing up your time for high-impact strategic leadership and creative problem-solving. Learn to refine backlogs, create strategic roadmaps, and integrate AI seamlessly into your agile ceremonies.
Gain predictive power by using AI-driven insights to anticipate project risks and seize new opportunities for more reliable outcomes. We deliver practical, prompt-based workflows and proven strategies built around real-world agile challenges that you can implement immediately within your framework.
Master foundational AI concepts specifically relevant to Scrum environments while developing advanced skills to handle diverse agile scenarios. You will learn to champion an AI-enabled culture within your organization, fostering a dynamic environment of continuous improvement and superior team delivery.
Ready to lead the future of agile and make data-driven decisions that cut through complexity? Join a community of forward-thinking professionals and position yourself as an indispensable leader in the AI era. Enroll now and unlock your future!

Lead with clarity, influence, and outcomes.
HK School of Management brings you a practical, no-fluff Leadership for Project Managers course—built for real projects, tight deadlines, and cross-functional teams. Learn to set direction, align stakeholders, and drive commitment without relying on title. For the price of a lunch, get proven playbooks, and downloadable templates. Backed by a 30-day money-back guarantee—zero risk, high impact.
Learn More