CHAPTER 9: Agile Estimation
The Competitive Edge for Modern Project Managers
9.1 Relative Estimation and Story Points
Introduction to Agile Estimation
Agile teams often need to answer a simple question: how big is this piece of work? Instead of looking for exact hours or days, they use relative estimation. Relative estimation is about comparing items to each other, not about predicting absolute effort. This approach helps reduce bias and avoids false precision. It also creates a common language within the team for discussing work complexity, effort, and uncertainty.
Why Relative Estimation Matters
Traditional project management often relies on detailed time estimates, but these can be unreliable. Knowledge work, especially software development, is full of uncertainty. Estimating in hours tends to give an illusion of accuracy that is rarely met in reality. Relative estimation allows teams to focus on what they can reliably compare. It shifts the question from “How long will this take?” to “How big is this compared to something else we already know?”
The Concept of Story Points
Story points are the most common unit used in relative estimation. A story point is not equal to an hour or a day. Instead, it is a number that reflects the combined complexity, effort, and risk of a user story. When a team assigns story points, they are capturing how big that item feels compared to other items. A story with 5 points is understood to be roughly twice as large or complex as one with 2 or 3 points, not because it takes exactly twice the hours, but because it involves about twice the overall challenge.
What Story Points Measure
Story points capture three main factors. First is effort, or how much work is required. Second is complexity, or how tricky or uncertain the task is. Third is risk, or how likely it is that surprises or unknowns will slow the work. A story with clear requirements and routine tasks may be small, while one with technical uncertainty or many dependencies may be large, even if the number of hours of typing is the same. This balance of factors is why story points work well for Agile teams.
Reference Stories as Anchors
To make estimation consistent, teams often choose reference stories. These are examples of stories that the team agrees represent certain sizes, such as a “2-point story” or a “5-point story.” When a new backlog item appears, the team asks, “Is this bigger, smaller, or about the same as our 5-point story?” This comparison helps reduce disagreement and builds a shared sense of scale over time. Reference stories act like anchors, keeping the estimation practice stable as the team gains experience.
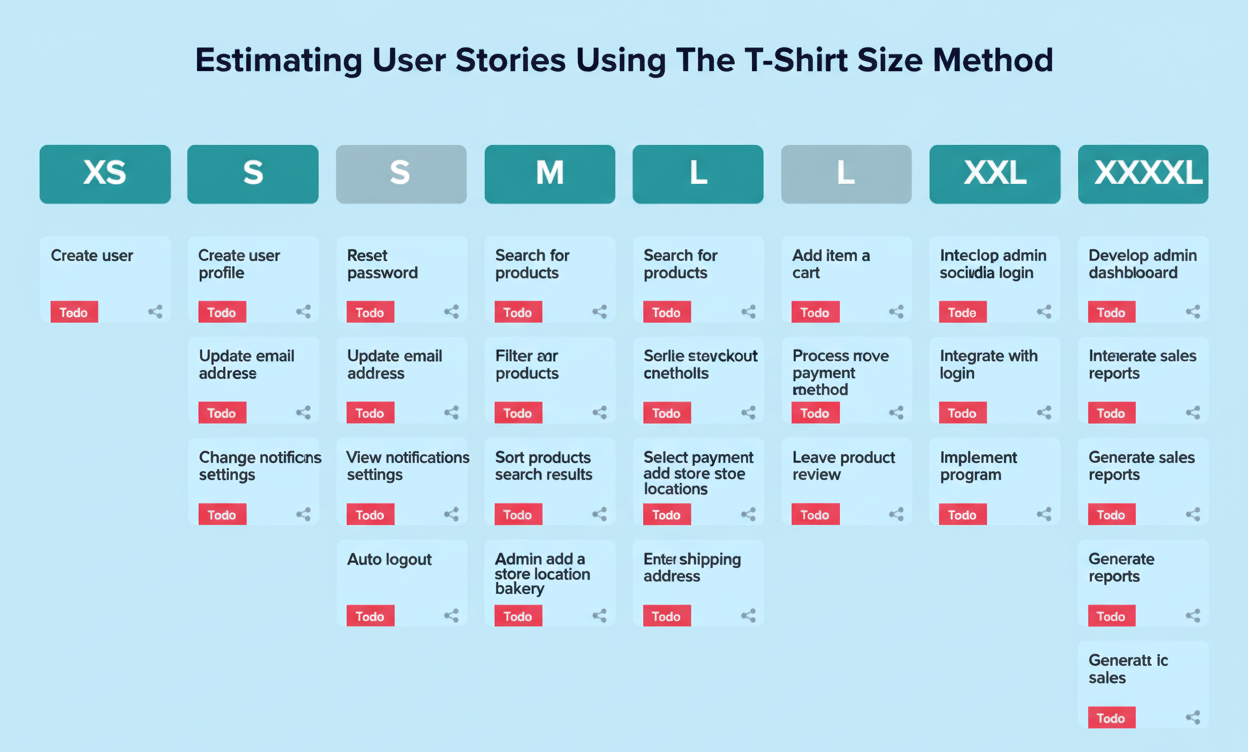
The Fibonacci Sequence in Story Points
Many teams use the Fibonacci sequence, or a modified version, for assigning story points. The sequence goes 1, 2, 3, 5, 8, 13, 21, and so on. The gaps between numbers increase as the items get larger. This makes sense because uncertainty grows as work gets bigger. Choosing between 8 and 13 is easier than choosing between 10 and 11. The wider spacing reflects the reality that large stories are harder to estimate precisely, so only rough comparisons are practical.
Benefits of Using Story Points
Using story points offers several benefits. They help teams avoid the trap of converting estimates into false commitments. They promote faster estimation sessions because the team focuses on comparison rather than perfect prediction. They encourage discussion about complexity, risk, and unknowns. Most importantly, story points create a foundation for measuring team velocity over time, which supports better forecasting in future sprints and releases.
Common Misunderstandings
Some teams misuse story points by trying to convert them back into hours. This defeats the purpose. Story points are not a currency that maps to time in a direct way. Another misunderstanding is assuming that different teams’ story points can be compared. A 5-point story for one team might be very different from a 5-point story for another. Story points are meant to be internal to each team, reflecting their context and experience.
Practical Tips for Teams
Start small by practicing with just a few backlog items. Agree on a simple scale and a couple of reference stories. Encourage conversation more than precision. Over time, the team will build confidence in estimating consistently. Remember that the goal is not to get perfect numbers but to enable planning, prioritization, and forecasting. Consistency within the team matters far more than being “right” about the actual size of work.
Conclusion
Relative estimation and story points help Agile teams handle uncertainty with confidence. By comparing work instead of predicting hours, teams can make faster, more reliable estimates. Story points capture the complexity, effort, and risk of user stories without tying them to unrealistic time commitments. With practice and reference stories, teams develop a shared scale that supports planning and forecasting. This simple but powerful tool lays the foundation for effective Agile estimation and helps teams focus on delivering value rather than defending hours.
9.2 Planning Poker and Estimation Games
Introduction to Team Estimation
Once a team understands story points, the next question is how to assign them in practice. Estimation is most powerful when done collaboratively. Each team member brings unique knowledge and perspective. Planning Poker and other estimation games make collaboration structured, fun, and effective. They help teams avoid bias, encourage participation, and quickly arrive at shared estimates for backlog items.
What is Planning Poker?
Planning Poker is the most popular Agile estimation technique. It is a structured card game used by teams to assign story points. Each participant has a deck of cards with numbers, usually the Fibonacci sequence. When a story is discussed, everyone privately selects a card to represent their estimate. All cards are revealed at the same time. This simultaneous reveal prevents people from being influenced by the first opinion voiced.
How the Game Works
The Product Owner explains a user story and answers questions. Team members discuss the requirements, risks, and uncertainties. When everyone feels ready, they each choose a card that reflects their estimate. After the cards are revealed, the highest and lowest estimators explain their reasoning. The group then discusses until a consensus or close agreement is reached. The process repeats for each story, creating a rhythm of discussion, reveal, and alignment.
Why Planning Poker Works
Planning Poker works because it balances group dynamics. It prevents anchoring, where early opinions dominate. It ensures all voices are heard, including quieter team members. It drives valuable conversations about what makes a story complex or risky. Instead of one expert estimating for everyone, the entire team shares knowledge and builds a collective understanding. The process is democratic, engaging, and surprisingly efficient.
Common Variations of Planning Poker
Some teams adjust the rules to fit their context. One variation is using physical cards, while others use digital tools for remote teams. Some teams set a time limit for each story to keep discussions focused. Others skip consensus if estimates are within one point apart, using the higher number by default. These small tweaks allow the technique to scale up for large backlogs without losing effectiveness.
Affinity Estimation
Another popular technique is affinity estimation. In this method, stories are quickly grouped by relative size. The team places all backlog items on a wall or virtual board and then sorts them into piles from smallest to largest. Once the rough order is established, the team assigns story points to each group. This method is very fast for estimating a large backlog and works best when many items need quick sizing before detailed planning.
The Bucket System
The bucket system is a collaborative game where teams place stories into “buckets” that represent point values. For example, buckets might be labeled 1, 2, 3, 5, 8, and 13. Stories are distributed among the buckets based on group discussion. If there is disagreement, the story can be moved until the team finds consensus. This system is particularly useful when dealing with dozens of backlog items, as it speeds up the process while still involving everyone.
Dot Voting and Other Games
Teams sometimes use dot voting, where members place stickers or virtual dots on the point values they believe best fit the story. The option with the most dots becomes the agreed estimate. Other creative games include “relative sizing with animals” where tasks are compared to animals like mice, cats, or elephants. These playful approaches can lower stress and make estimation less intimidating, while still creating consistent results.
.webp)
Choosing the Right Technique
The choice of estimation game depends on team size, backlog size, and project stage. Planning Poker works best for small to medium sets of stories that need careful discussion. Affinity estimation and bucket systems are better for quickly estimating large backlogs. Dot voting and playful methods can be used to break monotony or energize the team. The key is that all of these techniques foster collaboration and help the team own the estimates.
Common Pitfalls in Estimation Games
Despite their strengths, estimation games can go wrong. Some teams spend too much time debating small differences, turning estimation into an endless discussion. Others fall into the trap of converting story points back into hours, which undermines the purpose. It is also easy to misuse games by treating them as a form of commitment rather than a planning tool. Keeping estimation light, fast, and focused on relative size is the best way to avoid these pitfalls.
Conclusion
Planning Poker and other estimation games turn a challenging task into an engaging and collaborative process. They prevent bias, encourage shared ownership, and lead to better understanding of the work ahead. Whether the team is sorting stories by buckets, using dot voting, or flipping Planning Poker cards, the goal is the same: create quick, consistent, and reliable relative estimates. With practice, these games help teams improve accuracy, foster teamwork, and make backlog refinement sessions more productive and even enjoyable.
Reference - Blog Article:
The Project Leader’s Superpower: Prioritization and Decision-Making Tools That Actually Work
9.3 Forecasting with Velocity
Introduction to Velocity
Velocity is a simple but powerful metric in Agile projects. It tells us how much work a team can complete in a sprint, measured in story points. Unlike hours or days, velocity reflects the team’s actual capacity, not just planned effort. By looking at past sprints, teams can forecast how much they are likely to deliver in the future. This helps with planning releases and setting realistic expectations for stakeholders.
How Velocity is Calculated
Velocity is calculated by summing the story points of all items completed in a sprint. Only finished work counts. Partially completed stories are not included, because velocity is meant to measure delivered value. Over several sprints, a team’s velocity begins to stabilize, providing a reliable basis for forecasting. This historical average becomes a guide for future planning sessions.
Using Velocity for Forecasting
Velocity is most valuable when it is used for forecasting. For example, if a team consistently delivers around 25 story points per sprint, and the backlog contains 100 points, the team can expect to need about four sprints. Forecasting does not guarantee exact outcomes, but it helps stakeholders see a realistic range of possibilities. It also supports better prioritization, because the Product Owner can decide which features fit into a release window.
Understanding Variability
Velocity is rarely the same every sprint. Vacations, unexpected challenges, or scope changes affect how much the team delivers. That is why it is important to look at velocity over several sprints rather than relying on one data point. Some teams calculate a velocity range, such as 20 to 28 points per sprint, and use that range to forecast. This approach acknowledges variability while still providing valuable insight for planning.
Confidence Levels in Forecasting
Forecasts can be improved by using confidence levels. Instead of saying a backlog will be completed in exactly five sprints, a team might say there is a 70 percent chance of finishing in five sprints, and a 90 percent chance of finishing in six. This kind of probabilistic forecasting is more honest and useful. It sets clear expectations that software development is uncertain, while still giving leadership a reliable way to plan.
Velocity and Release Planning
Release planning becomes more effective when teams apply velocity. If a release must include 200 points of work, and the team averages 25 points per sprint, leaders can estimate that about eight sprints will be needed. If the deadline is fixed, the Product Owner can decide which items to include or exclude to meet the timeline. Velocity helps link backlog size to delivery schedules in a transparent way.
Limitations of Velocity
Velocity is a useful tool, but it has limits. It only applies to a stable team using story points consistently. If the team changes size, or switches estimation methods, velocity resets. Velocity also cannot be compared across teams, because story points are unique to each group. Finally, velocity is not a measure of productivity. A higher velocity does not mean a team is more efficient. It simply reflects their internal scale of work completed.
Common Pitfalls in Using Velocity
Some organizations misuse velocity by treating it as a performance target. This leads teams to inflate estimates or cut quality just to show higher numbers. Another pitfall is assuming velocity can be pushed upward indefinitely. Velocity should emerge naturally from how the team works, not from pressure. When used responsibly, velocity informs planning. When misused, it creates stress and undermines trust.
Improving Forecast Accuracy
Forecasting improves when teams consistently refine the backlog and estimate carefully. Regular backlog refinement ensures that stories are well understood before sprint planning. Consistency in using reference stories also reduces variance in estimates. Over time, as a team stabilizes, their velocity becomes more predictable, and forecasts become more accurate. Transparency about assumptions and risks further strengthens trust in the forecast.
Conclusion
Velocity gives Agile teams a practical way to forecast delivery. By measuring completed story points across sprints, teams can see their capacity and use it to predict future outcomes. When applied with care, velocity helps Product Owners plan releases, set stakeholder expectations, and balance scope against time. It is not a perfect tool, but when understood as a guide rather than a target, velocity supports smarter planning and helps Agile teams deliver value with confidence.
9.4 Agile Charts and Metrics
Introduction to Agile Metrics
Agile projects rely on transparency. Stakeholders need to know how work is progressing, and teams need feedback to adapt. Agile metrics provide that visibility. Instead of long status reports, Agile teams use simple charts and scorecards. These visuals show whether the team is on track, how work is flowing, and whether bottlenecks are forming. The most common tools are burndown charts, burnup charts, cumulative flow diagrams, and scorecards.
Burndown Charts
A burndown chart shows how much work remains in a sprint or release. The vertical axis represents story points or tasks. The horizontal axis represents time. Each day, the team plots how many points remain. Ideally, the line slopes steadily downward toward zero. If the line is flat, progress has stalled. If the line rises, scope has increased. Burndown charts are simple, quick to update, and easy for anyone to understand.
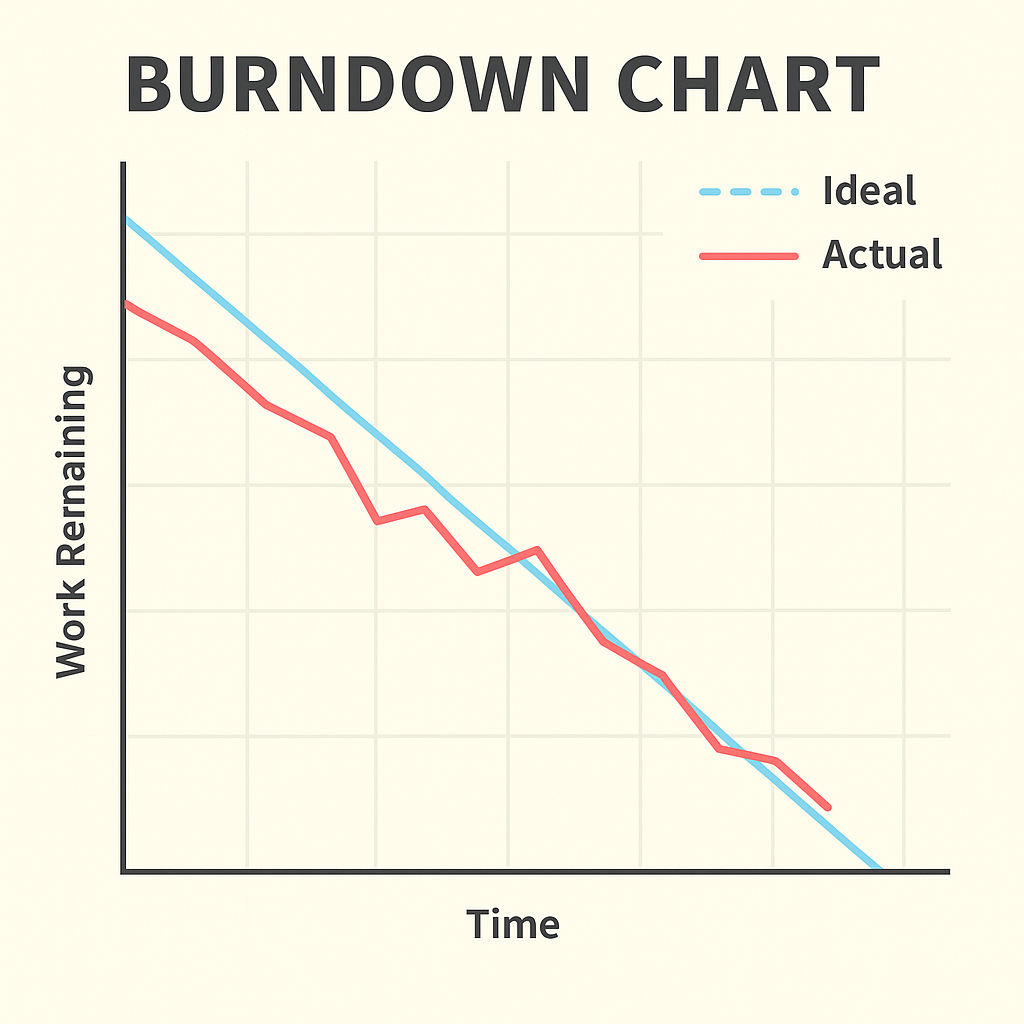
How to Read a Burndown Chart
Reading a burndown chart is about comparing the actual progress line against the ideal trend line. If the actual line is above the trend, the team is behind schedule. If it is below, the team is ahead. Burndown charts are most useful for short-term monitoring, such as within a sprint. They provide daily feedback and help the team decide whether to adjust focus, swarm on blocked tasks, or re-negotiate scope.
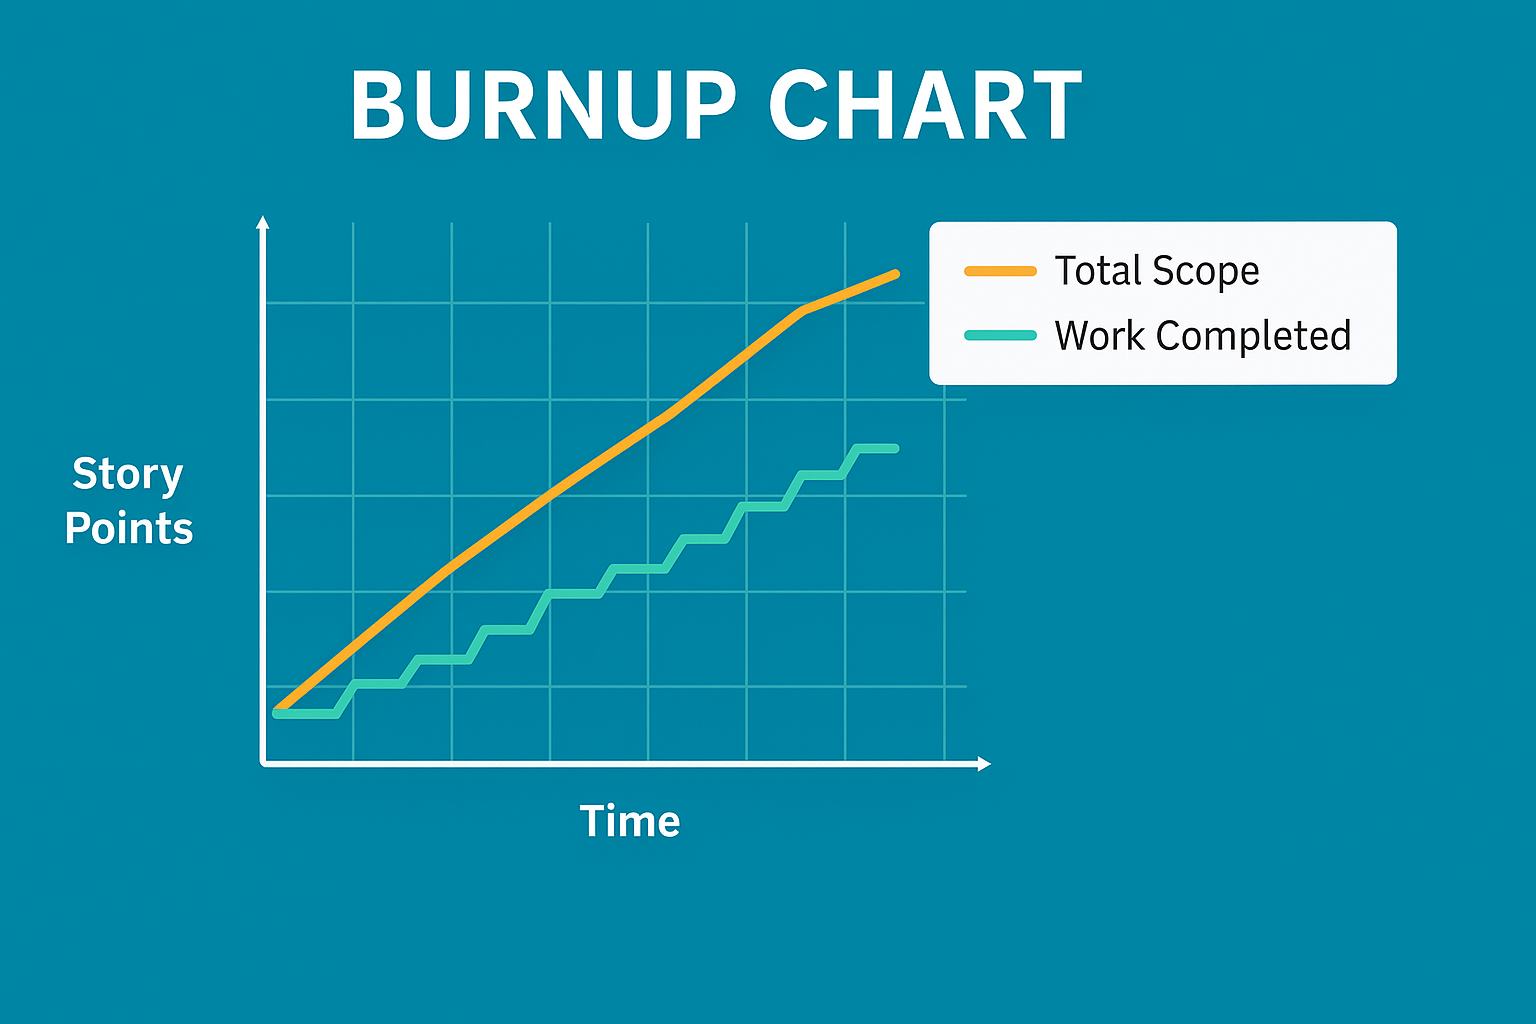
Burnup Charts
A burnup chart takes a different perspective. Instead of tracking work remaining, it shows work completed over time. The vertical axis shows story points delivered, and the top line shows total scope. If scope increases, the top line rises. If work is completed, the progress line moves upward. Burnup charts are excellent for release-level tracking, because they show both delivery progress and scope changes. This dual view helps teams and stakeholders understand why deadlines shift.
Cumulative Flow Diagrams
Cumulative flow diagrams, or CFDs, are powerful tools for understanding flow. A CFD shows work items in different states, such as to do, in progress, and done. Each state is represented as a colored band stacked over time. If the “in progress” band grows wider, it signals a bottleneck. If the “done” band grows steadily, the team is delivering value consistently. CFDs are particularly useful in Kanban and flow-based systems, but Scrum teams can benefit from them too.
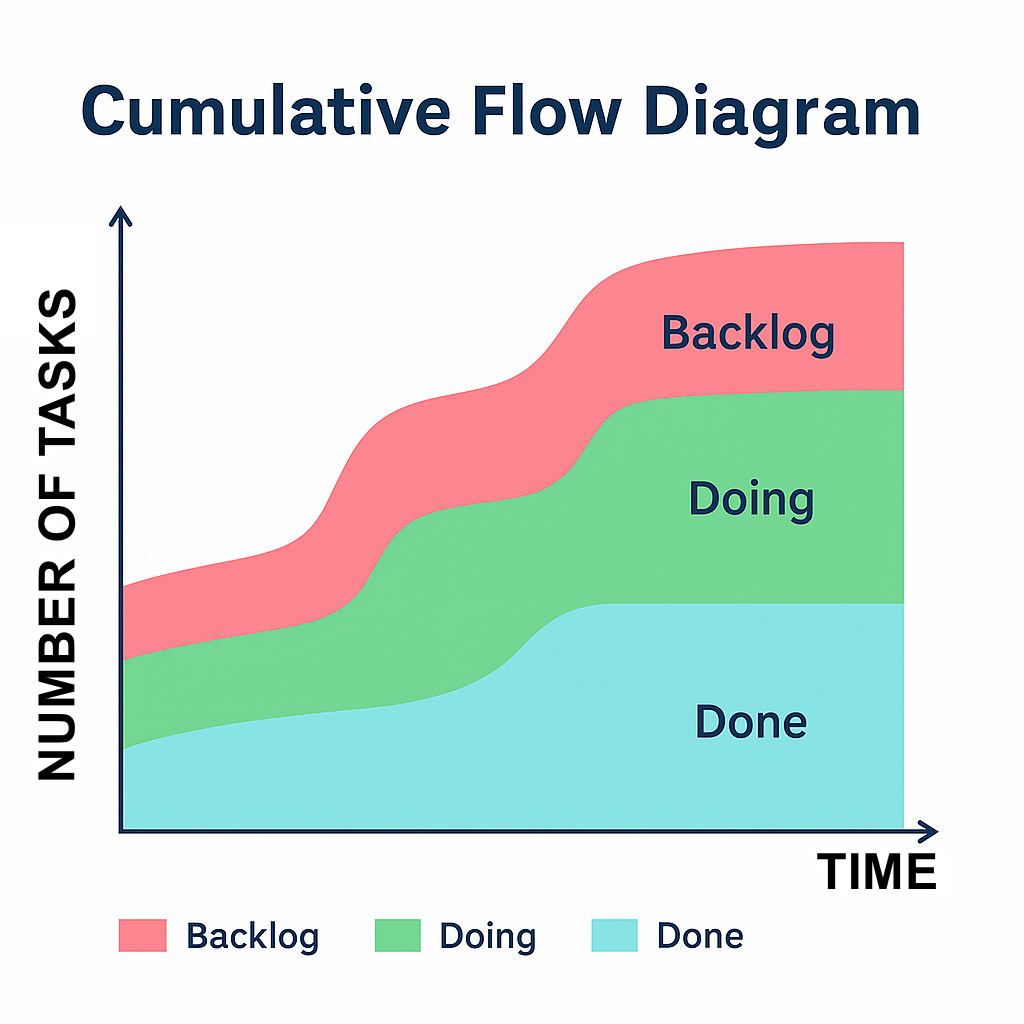
How to Use Cumulative Flow
The key to using a CFD is watching for stability. Healthy teams show relatively parallel bands, meaning work flows evenly. Large bulges in the middle band indicate too much work in progress. Sudden changes in the total height show scope changes. By adjusting work in progress limits and rebalancing team focus, teams can smooth out the flow. This leads to faster cycle times and more predictable delivery.
Agile Scorecards
Agile scorecards combine multiple metrics into a single view. They may include velocity trends, defect rates, lead times, and team health indicators. Scorecards are flexible and can be tailored to the organization’s priorities. For example, a team may track both business value delivered and technical debt reduced. Scorecards help ensure that success is measured broadly, not just by output, but also by quality and sustainability.
Choosing the Right Metric
Different metrics serve different purposes. Burndown charts are best for sprint tracking. Burnup charts are ideal for release forecasting. Cumulative flow diagrams reveal bottlenecks in flow. Scorecards provide a holistic picture of performance. Teams should choose the metrics that align with their goals and context. Overloading with charts can confuse rather than clarify, so it is better to focus on a few meaningful measures.
If you need help building the charts, visit our Downloads section for templates and the FAQ for step-by-step instructions.
Common Pitfalls in Using Metrics
Metrics are powerful, but they can be misused. A common pitfall is treating charts as performance targets rather than information tools. For example, forcing teams to “hit the burndown line” can lead to cutting corners. Another mistake is focusing only on output metrics, such as velocity, while ignoring outcome metrics, such as customer satisfaction. Metrics should guide improvement, not punish teams.
Conclusion
Agile charts and metrics turn progress into a visible, shared truth. Burndown and burnup charts show trends in work completed or remaining. Cumulative flow diagrams highlight how smoothly work moves through the system. Scorecards pull together multiple views into one snapshot. Used well, these tools help teams adapt, improve, and keep stakeholders aligned. Metrics are not about control. They are about learning and steering the project toward delivering value.
9.5 Avoiding Estimation Pitfalls
Introduction to Estimation Pitfalls
Agile estimation is a powerful tool when used correctly. It helps teams forecast, plan, and prioritize. However, many organizations misuse estimates, turning them into rigid commitments or performance targets. These pitfalls can erode trust, harm team morale, and distort decision-making. This covers common mistakes teams and leaders make with estimation and how to avoid them.
Estimates Are Not Commitments
One of the biggest misunderstandings in Agile is treating estimates as promises. An estimate is simply a forecast based on what is known today. It is not a guarantee of delivery. When leaders interpret a story point estimate as a fixed commitment, they set up teams for failure. Estimates should guide planning, not lock teams into unrealistic deadlines. Recognizing this difference protects both delivery and morale.
The Danger of Converting Story Points to Hours
Another pitfall is converting story points into hours. Story points are meant to capture relative size, not time. When managers try to create conversion formulas, they undermine the value of relative estimation. Story points lose their purpose, and pressure increases to meet hour-based targets. Teams should avoid mapping points to time and instead focus on using velocity for forecasting across sprints.
Misusing Velocity as a Performance Metric
Velocity is often misinterpreted as a measure of productivity. This leads organizations to push teams to increase velocity sprint after sprint. The result is estimate inflation, where teams assign higher point values to make velocity look better. This destroys the reliability of velocity and damages trust. Velocity should only be used as a planning tool within the team, not as a scoreboard for management.
Ignoring Variability and Uncertainty
Some leaders treat forecasts as certainties. They forget that software and knowledge work are inherently uncertain. Unexpected events, dependencies, and risks all affect delivery. By ignoring variability, stakeholders are surprised when forecasts are not met. A healthier approach is to use ranges and probabilities. Saying a feature will likely take between three and five sprints sets more realistic expectations than claiming an exact finish date.
Overestimating the Value of Estimation
Estimation is useful, but it is not the goal. Delivering customer value is the goal. Teams sometimes spend excessive time debating whether a story is five or eight points. That energy is better spent clarifying requirements or building working software. Estimates should be lightweight, fast, and good enough to support planning. Perfection in estimation is neither possible nor necessary.
Blaming Teams for Forecast Misses
A damaging pitfall occurs when leaders blame teams for not meeting estimated delivery. This creates fear, reduces transparency, and encourages teams to pad estimates. In a healthy Agile culture, forecasts are shared with humility and adjusted as new information emerges. When forecasts slip, the focus should be on learning, not punishment. Blame-free discussions lead to improvement, while punishment leads to dysfunction.
Healthy Practices to Avoid Pitfalls
There are practical ways to avoid these traps. Keep estimates relative and avoid converting them to hours. Use velocity as a team-level planning tool, not a management target. Present forecasts as ranges, not promises. Focus more on delivering value than on debating numbers. Encourage a culture where forecasts are treated as learning opportunities rather than commitments. These practices keep estimation aligned with Agile principles of transparency and adaptation.
Conclusion
Agile estimation is not about precision or accountability in the traditional sense. It is about helping teams and stakeholders make informed decisions in an uncertain environment. By avoiding pitfalls such as treating estimates as commitments, misusing velocity, or overvaluing precision, teams preserve the integrity of Agile estimation. Healthy practices ensure that estimates remain a guide, not a trap. When handled well, estimation supports trust, transparency, and value-driven delivery.
9.6 Using AI for Agile Estimation
AI in Agile Estimation
Artificial intelligence can become a supportive partner in Agile estimation. Instead of replacing team collaboration, AI provides data-driven insights, simulations, and templates that speed up the process. This covers how specific AI-driven prompts can help teams estimate more effectively. It shows how AI can act as a facilitator, run forecasts, simulate ranges, and prepare charts. These examples show how to combine human judgment with machine assistance for better planning.
AI as a Planning Poker Facilitator
With the right prompt, AI can act like a digital Planning Poker facilitator. It can present a user story, ask clarifying questions, and guide the team toward an estimate. For example, instead of one person dominating the discussion, AI ensures everyone’s perspective is captured before suggesting a story point size. This structured guidance helps distributed or hybrid teams run estimation sessions smoothly. AI does not decide the number—it prompts conversation and provides reasoning that supports consensus.
AI Forecasting with Historical Velocity
AI is particularly strong at analyzing past sprint data to create future forecasts. By inputting historical velocity, AI can calculate how many story points the team is likely to deliver in the next five sprints. It can even display this in a clear chart or table with confidence levels. This saves time for Scrum Masters and Product Owners, who often need to prepare release forecasts. The key is that the AI forecast is only a first draft—the team still reviews and adjusts it to reflect reality.
AI Simulating Velocity Fluctuations
Another valuable use of AI is simulating velocity fluctuations. Suppose your past sprint velocities were 20, 22, 19, and 25 points. Instead of guessing, AI can simulate hundreds of possible sprint outcomes and suggest a safe forecast range. For example, it might recommend planning based on a lower bound of 18 and an upper bound of 26 points per sprint. This provides stakeholders with a probabilistic view instead of a single number, which is more realistic and reduces the risk of overcommitment.
AI Estimating a Sprint Backlog
AI can also take a first pass at estimating story points for a sprint backlog. By analyzing story descriptions, past similar stories, and known complexity factors, AI can output a table with story, points, and justification. This does not replace team estimation, but it accelerates the process. Teams can then discuss the AI’s reasoning, agree with some estimates, and adjust others. This saves meeting time while still keeping human judgment at the center of estimation.
AI Generating Burndown Templates
One of the most practical uses of AI is creating charts on demand. With a sprint backlog and team velocity as inputs, AI can instantly generate a burndown chart template. This gives the Scrum Master a ready-to-use visualization to share in stand-ups and reviews. Instead of spending time formatting spreadsheets, the team gets a chart that updates quickly and clearly shows progress. The template becomes a living artifact, helping teams and stakeholders stay aligned.
AI Supporting Estimation Workshops
AI can also assist in planning estimation workshops. For example, with the right prompt it can design a workshop plan where the team practices three methods: Planning Poker, Affinity Estimation, and the Bucket System. It can set the sequence of activities, provide timeboxes, and outline expected outcomes. This is especially useful for new teams or trainers who need structured guidance. The team benefits by experiencing multiple estimation methods, while AI reduces the preparation effort.
Conclusion
AI does not replace Agile estimation—it enhances it. By acting as a facilitator, running forecasts, simulating ranges, and creating templates, AI speeds up the work and improves clarity. The prompts we explored show practical ways to integrate AI into backlog refinement, sprint planning, and team workshops. Always remember: AI provides inputs, but the team makes the final decisions. With this balanced approach, estimation becomes faster, more reliable, and still firmly rooted in Agile collaboration.
9.8 Hours vs. Points in Agile Estimation
Introduction
Agile methods strongly recommend using story points over hours for estimation. Story points emphasize relative sizing and reduce the illusion of precision. But in practice, some organizations still push for hours. This helps you balance Agile ideals with real-world workplace realities, and coach without burning bridges.
Why Agile Avoids Hours
Agile frameworks discourage hour-based estimation because hours focus on effort rather than complexity, risk, and uncertainty. Hours create pressure for false accuracy, often leading to missed deadlines. Story points avoid this trap by keeping focus on relative comparisons instead of exact time. They also make forecasting and velocity tracking simpler.
When Management Insists on Hours
Sometimes managers, especially from traditional project management backgrounds, simply do not understand story points. They are used to time-based reporting and want to see hours. In these cases, pushing back too hard can harm relationships. It is better to understand why they want hours, then build a bridge to Agile practices.
Pros and Cons of Each Approach
Hours are familiar and easy for managers to digest, but they often lead to rigid commitments and stress. Story points focus on relative effort, encourage collaboration, and build sustainable forecasting. The downside is that story points can feel abstract to those who have never worked with them. Both approaches have strengths and weaknesses depending on context.
Coaching Instead of Fighting
If your organization resists story points, do not fight it to the death. Instead, take the position of a coach. Provide hour-based reports when required, but also introduce story points to your team. Slowly help management see how points improve forecasting and focus on value delivery. Influence comes from trust, not conflict.
Speaking the Language of Your Audience
It does not matter how good your estimation technique is if nobody understands it. Your role is to communicate clearly in the language management expects, while gently introducing better Agile practices. If managers want hours, provide hours, but also show them what points reveal about flow, complexity, and progress.
Building Trust Through Results
The key to shifting estimation practices is showing results. Demonstrate the value your team delivers, and show how Agile methods improve predictability. Once managers see consistent delivery and customer value, they become more open to change. Success stories are more persuasive than arguments about methodology.
Conclusion
Agile does not endorse hours, but that does not mean you must fight every request. As a Scrum Master or Agile leader, your job is to balance principles with pragmatism. Provide the information your managers need, coach your team in story points, and over time, influence the shift. By preserving relationships and communicating in ways people understand, you create the foundation to guide your organization toward more effective Agile practices.
Leadership for Project Managers Course
Lead with clarity, confidence, and real impact. This Leadership for Project Managers course turns day-to-day challenges—unclear priorities, tough stakeholders, and cross-functional friction—into opportunities to guide teams and deliver outcomes that matter.
You’ll learn practical leadership skills tailored to project realities: setting direction without overcontrol, creating alignment across functions, and building commitment even when authority is limited. We go beyond theory with tools you can use immediately—one-sentence visioning, stakeholder influence maps, decision framing, and feedback scripts that actually land.
Expect hands-on frameworks, real-world examples, and guided practice to prepare for tough moments—executive readouts, resistance from stakeholders, and high-stakes negotiations. Downloadable templates and checklists keep everything actionable when the pace gets intense.
Ready to influence without waiting for a bigger title? Join a community of ambitious PMs, sharpen your edge, and deliver with purpose—project after project.

Take Control of Project Performance!
HK School of Management helps you go beyond status reports and gut feelings. In this advanced course, you’ll master Earned Value Management (EVM) to objectively measure progress, forecast outcomes, and take corrective action with confidence. Learn how WBS quality drives performance, how control accounts really work, and how to use EAC, TCPI, and variance analysis to make smarter decisions—before projects drift off track. Built around real-world examples and hands-on exercises, this course gives you practical tools you can apply immediately. Backed by our 30-day money-back guarantee—low risk, high impact for serious project professionals.
Learn More